Canadian Mining Industry Employment and Hiring Forecasts - MiHR
Canadian Mining Industry Employment and Hiring Forecasts - MiHR
Canadian Mining Industry Employment and Hiring Forecasts - MiHR

You also want an ePaper? Increase the reach of your titles
YUMPU automatically turns print PDFs into web optimized ePapers that Google loves.
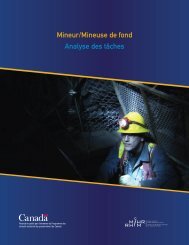
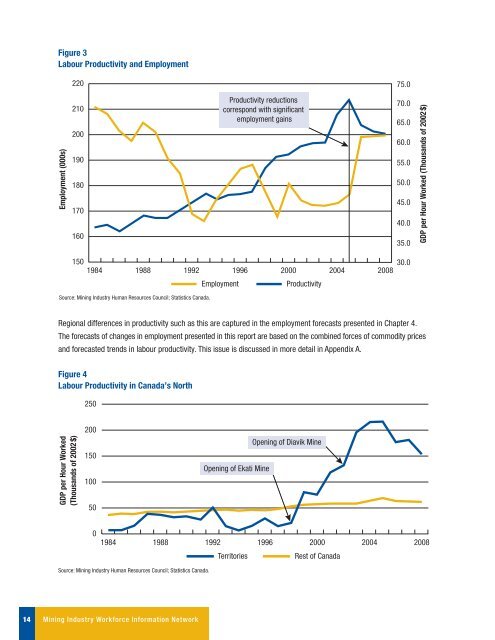
Figure 3<br />
Labour Productivity <strong>and</strong> <strong>Employment</strong><br />
220<br />
75.0<br />
<strong>Employment</strong> (000s)<br />
210<br />
200<br />
190<br />
180<br />
170<br />
160<br />
Productivity reductions<br />
correspond with significant<br />
employment gains<br />
70.0<br />
65.0<br />
60.0<br />
55.0<br />
50.0<br />
45.0<br />
40.0<br />
35.0<br />
GDP per Hour Worked (Thous<strong>and</strong>s of 2002 $)<br />
150<br />
1984 1988 1992 1996 2000 2004 2008<br />
<strong>Employment</strong><br />
Productivity<br />
30.0<br />
Source: <strong>Mining</strong> <strong>Industry</strong> Human Resources Council; Statistics Canada.<br />
Regional differences in productivity such as this are captured in the employment forecasts presented in Chapter 4.<br />
The forecasts of changes in employment presented in this report are based on the combined forces of commodity prices<br />
<strong>and</strong> forecasted trends in labour productivity. This issue is discussed in more detail in Appendix A.<br />
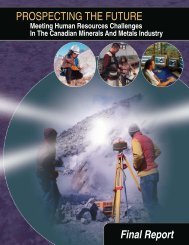
Figure 4<br />
Labour Productivity in Canada’s North<br />
250<br />
GDP per Hour Worked<br />
(Thous<strong>and</strong>s of 2002 $)<br />
200<br />
150<br />
100<br />
50<br />
Opening of Ekati Mine<br />
Opening of Diavik Mine<br />
0<br />
1984 1988<br />
1992 1996 2000 2004 2008<br />
Territories<br />
Rest of Canada<br />
Source: <strong>Mining</strong> <strong>Industry</strong> Human Resources Council; Statistics Canada.<br />
14 <strong>Mining</strong> <strong>Industry</strong> Workforce Information Network