Canadian Mining Industry Employment and Hiring Forecasts - MiHR
Canadian Mining Industry Employment and Hiring Forecasts - MiHR
Canadian Mining Industry Employment and Hiring Forecasts - MiHR

You also want an ePaper? Increase the reach of your titles
YUMPU automatically turns print PDFs into web optimized ePapers that Google loves.
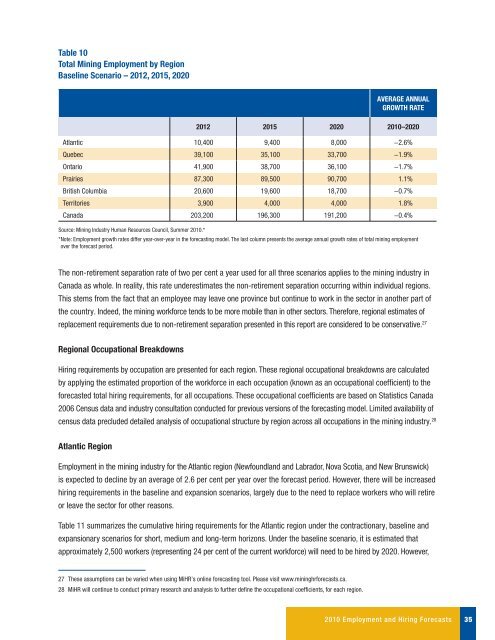
Table 10<br />
Total <strong>Mining</strong> <strong>Employment</strong> by Region<br />
Baseline Scenario – 2012, 2015, 2020<br />
Average Annual<br />
Growth Rate<br />
2012 2015 2020 2010–2020<br />
Atlantic 10,400 9,400 8,000 −2.6%<br />
Quebec 39,100 35,100 33,700 −1.9%<br />
Ontario 41,900 38,700 36,100 −1.7%<br />
Prairies 87,300 89,500 90,700 1.1%<br />
British Columbia 20,600 19,600 18,700 −0.7%<br />
Territories 3,900 4,000 4,000 1.8%<br />
Canada 203,200 196,300 191,200 −0.4%<br />
Source: <strong>Mining</strong> <strong>Industry</strong> Human Resources Council, Summer 2010.*<br />
*Note: <strong>Employment</strong> growth rates differ year-over-year in the forecasting model. The last column presents the average annual growth rates of total mining employment<br />
over the forecast period.<br />
The non-retirement separation rate of two per cent a year used for all three scenarios applies to the mining industry in<br />
Canada as whole. In reality, this rate underestimates the non-retirement separation occurring within individual regions.<br />
This stems from the fact that an employee may leave one province but continue to work in the sector in another part of<br />
the country. Indeed, the mining workforce tends to be more mobile than in other sectors. Therefore, regional estimates of<br />
replacement requirements due to non-retirement separation presented in this report are considered to be conservative. 27<br />
Regional Occupational Breakdowns<br />
<strong>Hiring</strong> requirements by occupation are presented for each region. These regional occupational breakdowns are calculated<br />
by applying the estimated proportion of the workforce in each occupation (known as an occupational coefficient) to the<br />
forecasted total hiring requirements, for all occupations. These occupational coefficients are based on Statistics Canada<br />
2006 Census data <strong>and</strong> industry consultation conducted for previous versions of the forecasting model. Limited availability of<br />
census data precluded detailed analysis of occupational structure by region across all occupations in the mining industry. 28<br />
Atlantic Region<br />
<strong>Employment</strong> in the mining industry for the Atlantic region (Newfoundl<strong>and</strong> <strong>and</strong> Labrador, Nova Scotia, <strong>and</strong> New Brunswick)<br />
is expected to decline by an average of 2.6 per cent per year over the forecast period. However, there will be increased<br />
hiring requirements in the baseline <strong>and</strong> expansion scenarios, largely due to the need to replace workers who will retire<br />
or leave the sector for other reasons.<br />
Table 11 summarizes the cumulative hiring requirements for the Atlantic region under the contractionary, baseline <strong>and</strong><br />
expansionary scenarios for short, medium <strong>and</strong> long-term horizons. Under the baseline scenario, it is estimated that<br />
approximately 2,500 workers (representing 24 per cent of the current workforce) will need to be hired by 2020. However,<br />
27 These assumptions can be varied when using <strong>MiHR</strong>’s online forecasting tool. Please visit www.mininghrforecasts.ca.<br />
28 <strong>MiHR</strong> will continue to conduct primary research <strong>and</strong> analysis to further define the occupational coefficients, for each region.<br />
2010 <strong>Employment</strong> <strong>and</strong> <strong>Hiring</strong> <strong>Forecasts</strong><br />
35