View Sample PDF - RBC Direct Investing
View Sample PDF - RBC Direct Investing
View Sample PDF - RBC Direct Investing

Create successful ePaper yourself
Turn your PDF publications into a flip-book with our unique Google optimized e-Paper software.
Global Investment Outlook • Eric Lascelles • Daniel E. Chornous, CFA • John Richards<br />
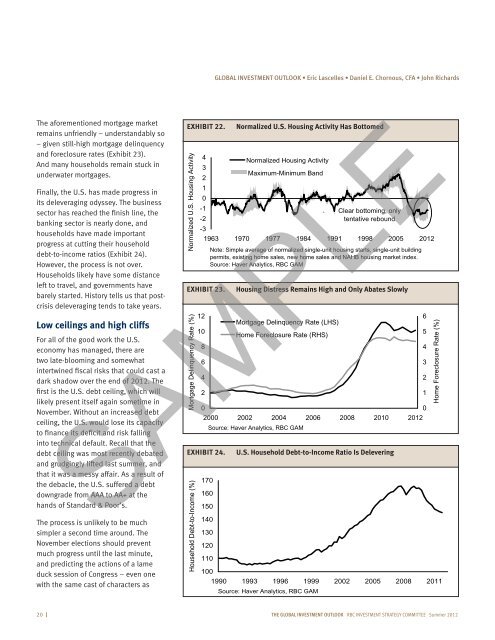
The aforementioned mortgage market<br />
remains unfriendly – understandably so<br />
– given still-high mortgage delinquency<br />
and foreclosure rates (Exhibit 23).<br />
And many households remain stuck in<br />
underwater mortgages.<br />
Finally, the U.S. has made progress in<br />
its deleveraging odyssey. The business<br />
sector has reached the finish line, the<br />
banking sector is nearly done, and<br />
households have made important<br />
progress at cutting their household<br />
debt-to-income ratios (Exhibit 24).<br />
However, the process is not over.<br />
Households likely have some distance<br />
left to travel, and governments have<br />
barely started. History tells us that postcrisis<br />
deleveraging tends to take years.<br />
Low ceilings and high cliffs<br />
For all of the good work the U.S.<br />
economy has managed, there are<br />
two late-blooming and somewhat<br />
intertwined fiscal risks that could cast a<br />
dark shadow over the end of 2012. The<br />
first is the U.S. debt ceiling, which will<br />
likely present itself again sometime in<br />
November. Without an increased debt<br />
ceiling, the U.S. would lose its capacity<br />
to finance its deficit and risk falling<br />
into technical default. Recall that the<br />
debt ceiling was most recently debated<br />
and grudgingly lifted last summer, and<br />
that it was a messy affair. As a result of<br />
the debacle, the U.S. suffered a debt<br />
downgrade from AAA to AA+ at the<br />
hands of Standard & Poor’s.<br />
The process is unlikely to be much<br />
simpler a second time around. The<br />
November elections should prevent<br />
much progress until the last minute,<br />
and predicting the actions of a lame<br />
duck session of Congress – even one<br />
with the same cast of characters as<br />
EXHIBIT 22.<br />
Normalized U.S. Housing Activity<br />
Normalized U.S. Housing Activity Has Bottomed<br />
4<br />
3<br />
2<br />
Normalized Housing Activity<br />
Maximum-Minimum Band<br />
1<br />
0<br />
-1<br />
Clear bottoming, only<br />
`<br />
-2<br />
tentative rebound<br />
-3<br />
1963 1970 1977 1984 1991 1998 2005 2012<br />
EXHIBIT 23.<br />
Mortgage Delinquency Rate (%)<br />
12<br />
10<br />
8<br />
6<br />
4<br />
2<br />
Note: Simple average of normalized single-unit housing starts, single-unit building<br />
permits, existing home sales, new home sales and NAHB housing market index.<br />
Source: Haver Analytics, <strong>RBC</strong> GAM<br />
Housing Distress Remains High and Only Abates Slowly<br />
Mortgage Delinquency Rate (LHS)<br />
Home Foreclosure Rate (RHS)<br />
0<br />
0<br />
2000 2002 2004 2006 2008 2010 2012<br />
Source: Haver Analytics, <strong>RBC</strong> GAM<br />
SAMPLE<br />
EXHIBIT 24.<br />
Household Debt-to-Income (%)<br />
170<br />
160<br />
150<br />
140<br />
130<br />
120<br />
110<br />
100<br />
U.S. Household Debt-to-Income Ratio Is Delevering<br />
1990 1993 1996 1999 2002 2005 2008 2011<br />
Source: Haver Analytics, <strong>RBC</strong> GAM<br />
6<br />
5<br />
4<br />
3<br />
2<br />
1<br />
Home Foreclosure Rate (%)<br />
20 I The global investment outlook <strong>RBC</strong> INVESTMENT Strategy coMMITTEE Summer 2012