View Sample PDF - RBC Direct Investing
View Sample PDF - RBC Direct Investing
View Sample PDF - RBC Direct Investing

You also want an ePaper? Increase the reach of your titles
YUMPU automatically turns print PDFs into web optimized ePapers that Google loves.
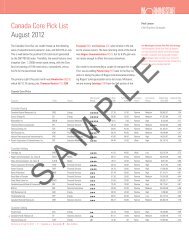
Recommended Asset Mix<br />
Asset mix – the allocation within<br />
portfolios to stocks, bonds and cash<br />
– should include both strategic and<br />
tactical elements. Strategic asset mix<br />
addresses the blend of the major asset<br />
classes offering the risk/return tradeoff<br />
best suited to an investor’s profile. It<br />
can be considered to be the benchmark<br />
investment plan that anchors a portfolio<br />
through many business and investment<br />
cycles, independent of a near-term view<br />
of the prospects for the economy and<br />
related expectations for capital markets.<br />
Tactical asset allocation refers to fine<br />
tuning around the strategic setting in an<br />
effort to add value by taking advantage<br />
of shorter term fluctuations in markets.<br />
Every individual has differing return<br />
expectations and tolerances for<br />
volatility, so there is no “one size fits<br />
all” strategic asset mix. Based on a<br />
35-year study of historical returns<br />
and the volatility of returns (the range<br />
around the average return within which<br />
shorter-term results tend to fall), we<br />
have developed five broad profiles<br />
and assigned a benchmark strategic<br />
asset mix for each. These profiles<br />
range from very conservative through<br />
balanced to aggressive growth. It goes<br />
without saying that as investors accept<br />
increasing levels of volatility, and<br />
therefore greater risk that the actual<br />
experience will depart from the longerterm<br />
norm, the potential for returns<br />
rises. The five profiles presented below<br />
may assist investors in selecting a<br />
strategic asset mix best aligned to their<br />
investment goals.<br />
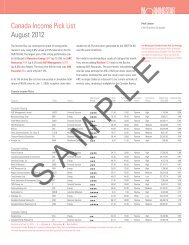
Each quarter, the <strong>RBC</strong> Investment<br />
Strategy Committee publishes a<br />
recommended asset mix based on<br />
our current view of the economy and<br />
return expectations for the major asset<br />
classes. These weights are further<br />
divided into recommended exposures<br />
to the variety of global fixed income and<br />
equity markets. Our recommendation is<br />
targeted at the Balanced profile where<br />
the benchmark setting is 55% equities,<br />
40% fixed income, 5% cash.<br />
A tactical range of +/- 15% around the<br />
benchmark position allows us to raise or<br />
lower exposure to specific asset classes<br />
Global Asset Mix<br />
Benchmark<br />
Policy<br />
Past<br />
Range<br />
Spring<br />
2012<br />
March 28, April 16,<br />
2012 2012<br />
May 10,<br />
2012<br />
Summer<br />
2012<br />
Cash 5.0% 1.5% – 16% 7.5% 6.5% 6.5% 6.5% 5.5%<br />
Bonds 40.0% 25% – 54% 35.0% 37.0% 36.0% 35.0% 35.0%<br />
Stocks 55.0% 36% – 65% 57.5% 56.5% 57.5% 58.5% 59.5%<br />
Regional Allocation<br />
Global Bonds<br />
CWGBI*<br />
May 2012<br />
Past<br />
Range<br />
Summer<br />
2011<br />
FALL<br />
2011<br />
New year<br />
2012<br />
Spring<br />
2012<br />
Summer<br />
2012<br />
North America 32.5% 18% – 37% 34.8% 35.0% 33.7% 36.9% 29.5%<br />
Europe 35.3% 32% – 56% 35.8% 34.5% 31.7% 32.6% 35.3%<br />
Asia 32.2% 20% – 35% 29.5% 30.5% 34.6% 30.5% 35.3%<br />
Note: Based on anticipated 12-month returns in $US hedged basis<br />
MSCI** Past<br />
Global Equities<br />
May 2012 Range<br />
FALL<br />
2011<br />
New year<br />
2012<br />
Spring<br />
2012<br />
April 16,<br />
2012<br />
Summer<br />
2012<br />
North America 58.5% 51% – 60% 56.0% 58.3% 58.8% 57.0% 59.5%<br />
Europe 23.5% 23% – 35% 24.3% 23.3% 23.3% 24.1% 22.8%<br />
Asia 12.6% 10% – 18% 13.3% 12.5% 12.0% 12.9% 11.5%<br />
Emerging Markets 5.5% 0% – 6.5% 6.5% 6.0% 6.0% 6.0% 6.3%<br />
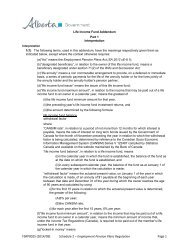
Global Equity sector allocation<br />
MSCI**<br />
May 2012<br />
<strong>RBC</strong> ISC<br />
Spring 2012<br />
with a goal of tilting portfolios toward<br />
those markets that offer comparatively<br />
attractive near-term prospects.<br />
This tactical recommendation for the<br />
Balanced profile can serve as a guide<br />
for movement within the ranges allowed<br />
for all other profiles. If, for example, the<br />
recommended current equity exposure<br />
for the Balanced profile is set at 62.5%<br />
<strong>RBC</strong> ISC Change FROM<br />
summer 2012 spring 2012<br />
Continued on next page...<br />
SAMPLE<br />
WEIGHT vs.<br />
BENCHMARK<br />
Energy 10.97% 11.46% 10.00% (1.46) 91.15%<br />
Materials 7.09% 7.68% 7.00% (0.68) 98.76%<br />
Industrials 11.00% 13.30% 11.00% (2.30) 100.00%<br />
Consumer Discretionary 10.98% 11.54% 12.25% 0.71 111.58%<br />
Consumer Staples 10.80% 10.31% 11.80% 1.48 109.26%<br />
Health Care 10.23% 10.08% 10.25% 0.17 100.17%<br />
Financials 18.51% 17.69% 18.50% 0.81 99.93%<br />
Information Technology 12.80% 14.26% 14.50% 0.24 113.25%<br />
Telecom. Services 3.98% 2.00% 3.20% 1.20 80.37%<br />
Utilities 3.64% 1.67% 1.50% (0.17) 41.26%<br />
*Citigroup World Global Bond Index **MSCI World Index Source: <strong>RBC</strong> Investment Strategy Committee<br />
The global investment outlook <strong>RBC</strong> INVESTMENT Strategy coMMITTEE Summer 2012 I 5