View Sample PDF - RBC Direct Investing
View Sample PDF - RBC Direct Investing
View Sample PDF - RBC Direct Investing

You also want an ePaper? Increase the reach of your titles
YUMPU automatically turns print PDFs into web optimized ePapers that Google loves.
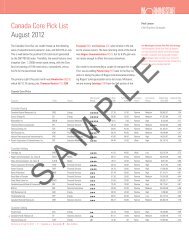
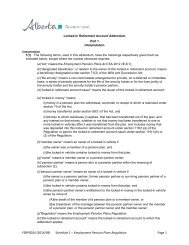
Recommended Asset Mix<br />
Balanced<br />
Asset Class<br />
RANGE<br />
Last Current<br />
quarter recommendation<br />
Cash & Cash Equivalents 5% 0-15% 7.5% 5.5%<br />
Fixed Income 40% 20-60% 35.0% 35.0%<br />
Total Cash & Fixed Income 45% 30-60% 42.5% 40.5%<br />
Canadian Equities 20% 10-30% 21.1% 20.5%<br />
U.S. Equities 20% 10-30% 23.2% 24.0%<br />
International Equities 12% 5-25% 9.7% 11.5%<br />
Emerging markets 3% 0-10% 3.5% 3.5%<br />
Total Equities 55% 40-70% 57.5% 59.5%<br />
Growth<br />
Asset Class<br />
Range<br />
Last Current<br />
quarter recommendation<br />
Cash & Cash Equivalents 5% 0-15% 7.5% 5.5%<br />
Fixed Income 25% 5-40% 19.7% 19.6%<br />
Total Cash & Fixed Income 30% 15-45% 27.2% 25.1%<br />
Canadian Equities 25% 15-35% 26.2% 25.5%<br />
U.S. Equities 25% 15-35% 28.5% 29.3%<br />
International Equities 16% 10-30% 13.1% 15.0%<br />
Emerging markets 4% 0-10% 5.0% 5.1%<br />
Total Equities 70% 55-85% 72.8% 74.9%<br />
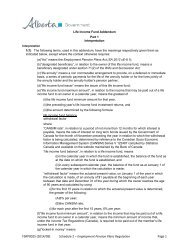
Aggressive Growth<br />
Asset Class<br />
Benchmark<br />
Benchmark<br />
Benchmark<br />
Range<br />
Return<br />
Volatility<br />
35-year average 9.7% 8.9%<br />
Last 12 months -0.2% 5.5%<br />
Return<br />
Volatility<br />
35-year average 9.9% 11.1%<br />
Last 12 months -2.8% 7.3%<br />
Last Current<br />
quarter recommendation<br />
Cash & Cash Equivalents 5% 0-15% 5.0% 3.0%<br />
Fixed Income 0% 0-10% 0.0% 0.0%<br />
Total Cash & Fixed Income 5% 0-20% 5.0% 3.0%<br />
Canadian Equities 35% 20-50% 35.5% 35.4%<br />
U.S. Equities 30% 15-45% 33.1% 34.4%<br />
International Equities 22.5% 10-35% 19.4% 19.9%<br />
EMERGING MARKETS 7.5% 0-15% 7.0% 7.3%<br />
Total Equities 95% 80-100% 95.0% 97.0%<br />
The Balanced portfolio is appropriate for<br />
investors seeking balance between long-term<br />
capital growth and capital preservation, with a<br />
secondary focus on modest income, and who are<br />
comfortable with moderate fluctuations in the<br />
value of their investments. More than half the<br />
portfolio will usually be invested in a diversified<br />
mix of Canadian, U.S. and global equities. This<br />
profile is suitable for investors who plan to hold<br />
their investment for the medium to long term<br />
(minimum five to seven years).<br />
Investors who fit the Growth profile will seek<br />
long-term growth over capital preservation<br />
and regular income, and be comfortable with<br />
considerable fluctuations in the value of their<br />
investments. This portfolio primarily holds a<br />
diversified mix of Canadian, U.S. and global<br />
equities and is suitable for investors who plan to<br />
invest for the long term (minimum seven to ten<br />
years).<br />
SAMPLE<br />
Return<br />
Volatility<br />
35-year average 9.9% 13.7%<br />
Last 12 months -7.8% 10.5%<br />
Aggressive Growth investors seek maximum longterm<br />
growth over capital preservation and regular<br />
income, and are comfortable with significant<br />
fluctuations in the value of their investments.<br />
The portfolio is almost entirely invested in stocks<br />
and emphasizes exposure to global equities. This<br />
investment profile is suitable only for investors<br />
with a high risk tolerance and who plan to hold<br />
their investments for the long term (minimum<br />
seven to ten years).<br />
The global investment outlook <strong>RBC</strong> INVESTMENT Strategy coMMITTEE Summer 2012 I 7