View Sample PDF - RBC Direct Investing
View Sample PDF - RBC Direct Investing
View Sample PDF - RBC Direct Investing

You also want an ePaper? Increase the reach of your titles
YUMPU automatically turns print PDFs into web optimized ePapers that Google loves.
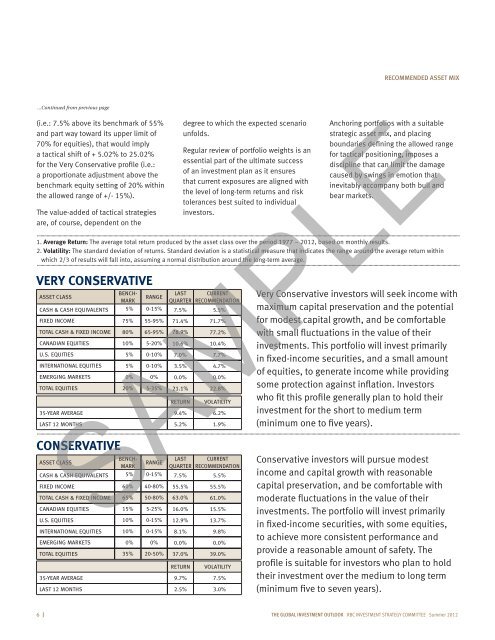
Recommended Asset Mix<br />
...Continued from previous page<br />
(i.e.: 7.5% above its benchmark of 55%<br />
and part way toward its upper limit of<br />
70% for equities), that would imply<br />
a tactical shift of + 5.02% to 25.02%<br />
for the Very Conservative profile (i.e.:<br />
a proportionate adjustment above the<br />
benchmark equity setting of 20% within<br />
the allowed range of +/- 15%).<br />
The value-added of tactical strategies<br />
are, of course, dependent on the<br />
Very conservative<br />
Asset Class<br />
Range<br />
Last Current<br />
quarter recommendation<br />
Cash & Cash Equivalents 5% 0-15% 7.5% 5.5%<br />
Fixed Income 75% 55-95% 71.4% 71.7%<br />
Total Cash & Fixed Income 80% 65-95% 78.9% 77.2%<br />
Canadian Equities 10% 5-20% 10.6% 10.4%<br />
U.S. Equities 5% 0-10% 7.0% 7.7%<br />
International Equities 5% 0-10% 3.5% 4.7%<br />
Emerging markets 0% 0% 0.0% 0.0%<br />
Total Equities 20% 5-35% 21.1% 22.8%<br />
Conservative<br />
Asset Class<br />
Benchmark<br />
Benchmark<br />
Range<br />
Return<br />
Last Current<br />
quarter recommendation<br />
Cash & Cash Equivalents 5% 0-15% 7.5% 5.5%<br />
Fixed Income 60% 40-80% 55.5% 55.5%<br />
Total Cash & Fixed Income 65% 50-80% 63.0% 61.0%<br />
Canadian Equities 15% 5-25% 16.0% 15.5%<br />
U.S. Equities 10% 0-15% 12.9% 13.7%<br />
International Equities 10% 0-15% 8.1% 9.8%<br />
emerging markets 0% 0% 0.0% 0.0%<br />
Total Equities 35% 20-50% 37.0% 39.0%<br />
degree to which the expected scenario<br />
unfolds.<br />
Regular review of portfolio weights is an<br />
essential part of the ultimate success<br />
of an investment plan as it ensures<br />
that current exposures are aligned with<br />
the level of long-term returns and risk<br />
tolerances best suited to individual<br />
investors.<br />
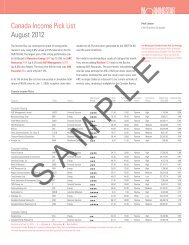
1. Average Return: The average total return produced by the asset class over the period 1977 – 2012, based on monthly results.<br />
2. Volatility: The standard deviation of returns. Standard deviation is a statistical measure that indicates the range around the average return within<br />
which 2/3 of results will fall into, assuming a normal distribution around the long-term average.<br />
Volatility<br />
35-year average 9.4% 6.2%<br />
Last 12 months 5.2% 1.9%<br />
Anchoring portfolios with a suitable<br />
strategic asset mix, and placing<br />
boundaries defining the allowed range<br />
for tactical positioning, imposes a<br />
discipline that can limit the damage<br />
caused by swings in emotion that<br />
inevitably accompany both bull and<br />
bear markets.<br />
Very Conservative investors will seek income with<br />
maximum capital preservation and the potential<br />
for modest capital growth, and be comfortable<br />
with small fluctuations in the value of their<br />
investments. This portfolio will invest primarily<br />
in fixed-income securities, and a small amount<br />
of equities, to generate income while providing<br />
some protection against inflation. Investors<br />
who fit this profile generally plan to hold their<br />
investment for the short to medium term<br />
(minimum one to five years).<br />
SAMPLE<br />
Return<br />
Volatility<br />
35-year average 9.7% 7.5%<br />
Last 12 months 2.5% 3.0%<br />
Conservative investors will pursue modest<br />
income and capital growth with reasonable<br />
capital preservation, and be comfortable with<br />
moderate fluctuations in the value of their<br />
investments. The portfolio will invest primarily<br />
in fixed-income securities, with some equities,<br />
to achieve more consistent performance and<br />
provide a reasonable amount of safety. The<br />
profile is suitable for investors who plan to hold<br />
their investment over the medium to long term<br />
(minimum five to seven years).<br />
6 I The global investment outlook <strong>RBC</strong> INVESTMENT Strategy coMMITTEE Summer 2012