View Sample PDF - RBC Direct Investing
View Sample PDF - RBC Direct Investing
View Sample PDF - RBC Direct Investing

You also want an ePaper? Increase the reach of your titles
YUMPU automatically turns print PDFs into web optimized ePapers that Google loves.
Currency markets • Dagmara Fijalkowski, MBA, CFA<br />
lower than the consensus, we don’t<br />
consider it overly aggressive.<br />
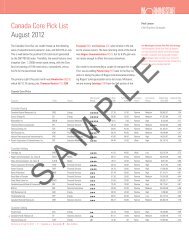
The Canadian dollar<br />
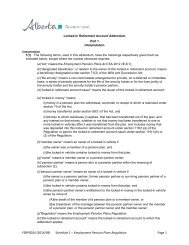
As for the Canadian dollar, our<br />
discussion must start with PPP<br />
valuations, since our currency is again<br />
flirting with the line in the sand (Exhibit<br />
11). Historically, the upside potential<br />
of buying the loonie at these levels<br />
is not attractive, and the currency’s<br />
forays beyond this 20% threshold have<br />
typically lasted months rather than<br />
years. Much of the good story on the<br />
Canadian dollar is already priced in.<br />
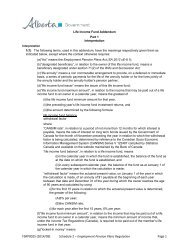
Keeping that in mind, we note that<br />
shorter-term valuations are more in<br />
line with current price levels, although<br />
there is a significant divergence of<br />
views in the market. Our own shortterm<br />
model, which is based on different<br />
monetary policies, commodity prices<br />
and differences in growth proxies,<br />
justifies exchange rates within 2% of<br />
parity (Exhibit 12). From a short-term<br />
valuation perspective, the Canadian<br />
dollar remains first and foremost a<br />
proxy for growth and, unless we expect<br />
growth to accelerate in 2012, the<br />
upside is limited. The same goes for<br />
the downside.<br />
It appears that in the absence of<br />
growth surprises or other unexpected<br />
macroeconomic developments, the<br />
Canadian dollar will remain comfortably<br />
around parity. Even after the Bank of<br />
Canada’s shift to a more hawkish tone<br />
in April significantly raised expectations<br />
of interest rate hikes, the loonie barely<br />
budged. The positive effect of monetary<br />
policy was overwhelmed by general<br />
risk aversion surrounding the Greek<br />
elections in May. Our view is that the<br />
change in the BOC’s stance would<br />
EXHIBIT 11.<br />
1.70<br />
1.60<br />
1.50<br />
1.40<br />
1.30<br />
1.20<br />
1.10<br />
1.00<br />
0.90<br />
1973 1976 1979 1982 1986 1989 1992 1995 1999 2002 2005 2008 2012<br />
EXHIBIT 12.<br />
1.06<br />
1.02<br />
0.98<br />
0.94<br />
0.90<br />
USDCAD Short-Term Valuation Model<br />
S&P 500, WTI Oil and 2-Year Interest Rate Differential<br />
Actual<br />
Model Estimate<br />
Actual Value: 1.03<br />
Estimated Value: 1.01<br />
Dec-10 Mar-11 Jun-11 Sep-11 Dec-11 Mar-12 Jun-12<br />
Source: <strong>RBC</strong> GAM, Bloomberg<br />
EXHIBIT 13.<br />
8%<br />
6%<br />
4%<br />
2%<br />
0%<br />
-2%<br />
-4%<br />
-6%<br />
USDCAD vs. Purchasing Power Parity<br />
PPP Average USDCAD 20% Bands<br />
Source: <strong>RBC</strong> GAM, Bloomberg<br />
SAMPLE<br />
Canada External Balances<br />
Current Account Balance (% of GDP)<br />
Foreign <strong>Direct</strong> Investment Balance (% of GDP)<br />
Portfolio Flows (% of GDP)<br />
2000 2001 2002 2003 2004 2005 2006 2007 2008 2009 2010 2011<br />
Source: Haver Analytics<br />
The global investment outlook <strong>RBC</strong> INVESTMENT Strategy coMMITTEE Summer 2012 I 47