View Sample PDF - RBC Direct Investing
View Sample PDF - RBC Direct Investing
View Sample PDF - RBC Direct Investing

You also want an ePaper? Increase the reach of your titles
YUMPU automatically turns print PDFs into web optimized ePapers that Google loves.
Global Investment Outlook • Eric Lascelles • Daniel E. Chornous, CFA • John Richards<br />
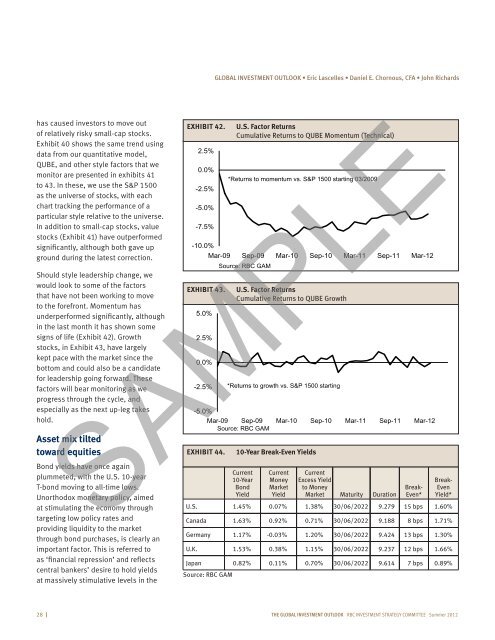
has caused investors to move out<br />
of relatively risky small-cap stocks.<br />
Exhibit 40 shows the same trend using<br />
data from our quantitative model,<br />
QUBE, and other style factors that we<br />
monitor are presented in exhibits 41<br />
to 43. In these, we use the S&P 1500<br />
as the universe of stocks, with each<br />
chart tracking the performance of a<br />
particular style relative to the universe.<br />
In addition to small-cap stocks, value<br />
stocks (Exhibit 41) have outperformed<br />
significantly, although both gave up<br />
ground during the latest correction.<br />
Should style leadership change, we<br />
would look to some of the factors<br />
that have not been working to move<br />
to the forefront. Momentum has<br />
underperformed significantly, although<br />
in the last month it has shown some<br />
signs of life (Exhibit 42). Growth<br />
stocks, in Exhibit 43, have largely<br />
kept pace with the market since the<br />
bottom and could also be a candidate<br />
for leadership going forward. These<br />
factors will bear monitoring as we<br />
progress through the cycle, and<br />
especially as the next up-leg takes<br />
hold.<br />
Asset mix tilted<br />
toward equities<br />
Bond yields have once again<br />
plummeted, with the U.S. 10-year<br />
T-bond moving to all-time lows.<br />
Unorthodox monetary policy, aimed<br />
at stimulating the economy through<br />
targeting low policy rates and<br />
providing liquidity to the market<br />
through bond purchases, is clearly an<br />
important factor. This is referred to<br />
as ‘financial repression’ and reflects<br />
central bankers’ desire to hold yields<br />
at massively stimulative levels in the<br />
EXHIBIT 42.<br />
2.5%<br />
0.0%<br />
-2.5%<br />
-5.0%<br />
-7.5%<br />
-10.0%<br />
EXHIBIT 43.<br />
5.0%<br />
2.5%<br />
0.0%<br />
-2.5%<br />
U.S. Factor Returns<br />
Cumulative Returns to QUBE Momentum (Technical)<br />
*Returns to momentum vs. S&P 1500 starting 03/2009<br />
Mar-09 Sep-09 Mar-10 Sep-10 Mar-11 Sep-11 Mar-12<br />
Source: <strong>RBC</strong> GAM<br />
U.S. Factor Returns<br />
Cumulative Returns to QUBE Growth<br />
*Returns to growth vs. S&P 1500 starting<br />
-5.0%<br />
Mar-09 Sep-09 Mar-10 Sep-10 Mar-11 Sep-11 Mar-12<br />
Source: <strong>RBC</strong> GAM<br />
SAMPLE<br />
EXHIBIT 44.<br />
10-Year Break-Even Yields<br />
Current<br />
10-Year<br />
Bond<br />
Yield<br />
Current<br />
Money<br />
Market<br />
Yield<br />
Current<br />
Excess Yield<br />
to Money<br />
Market Maturity Duration<br />
Break-<br />
Even*<br />
Break-<br />
Even<br />
Yield*<br />
U.S. 1.45% 0.07% 1.38% 30/06/2022 9.279 15 bps 1.60%<br />
Canada 1.63% 0.92% 0.71% 30/06/2022 9.188 8 bps 1.71%<br />
Germany 1.17% -0.03% 1.20% 30/06/2022 9.424 13 bps 1.30%<br />
U.K. 1.53% 0.38% 1.15% 30/06/2022 9.237 12 bps 1.66%<br />
Japan 0.82% 0.11% 0.70% 30/06/2022 9.614 7 bps 0.89%<br />
Source: <strong>RBC</strong> GAM<br />
28 I The global investment outlook <strong>RBC</strong> INVESTMENT Strategy coMMITTEE Summer 2012