View Sample PDF - RBC Direct Investing
View Sample PDF - RBC Direct Investing
View Sample PDF - RBC Direct Investing

You also want an ePaper? Increase the reach of your titles
YUMPU automatically turns print PDFs into web optimized ePapers that Google loves.
Regional Outlook – Canada<br />
Stuart Kedwell, CFA<br />
Senior V.P. & Senior Portfolio Manager<br />
<strong>RBC</strong> Global Asset Management Inc.<br />
The S&P/TSX Composite Index<br />
extended its underperformance<br />
versus the S&P 500 Index, with an<br />
8% decline during the most recent<br />
quarter, roughly double the pullback in<br />
the S&P 500. S&P/TSX earnings have<br />
leveled off almost 10% below the prior<br />
peak, while S&P 500 earnings have<br />
surpassed levels witnessed earlier in<br />
the decade. All major sector groups<br />
in the S&P/TSX Composite declined<br />
during the quarter, led by gold and<br />
energy, as the underlying commodities<br />
rolled over. We expect 2% growth<br />
from the Canadian economy in 2013,<br />
similar to the level expected in the<br />
U.S. Given a weakening Canadian<br />
dollar, a relatively modest earnings<br />
recovery, worries about the Canadian<br />
housing market and the reemergence<br />
of concerns that Canada could be<br />
negatively affected by slowing Chinese<br />
growth, the likelihood that Canada’s<br />
equity market will keep outperforming<br />
the S&P 500 continues to decrease.<br />
The Canadian dollar fell 4% during the<br />
quarter and briefly traded through our<br />
target. With a forecast for moderating<br />
economic growth, we continue to<br />
believe that the strength of the<br />
Canadian dollar versus the U.S. dollar<br />
has largely run its course, especially<br />
over the intermediate term.<br />
Investor sentiment is now back in<br />
the mid 30% bullish range, the same<br />
level as last fall when markets began<br />
to rally, and well below the 55%<br />
reading in February. The debate about<br />
the headwinds facing earnings and<br />
equity markets has resurfaced, leaving<br />
valuations at attractive levels over the<br />
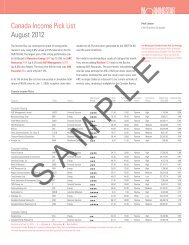
Canada Recommended Sector Weights<br />
<strong>RBC</strong> Investment<br />
strategy committee<br />
may 2012<br />
Benchmark<br />
S&P/TSX composite<br />
may 2012<br />
Energy 26.0% 26.1%<br />
Materials 19.0% 19.2%<br />
Industrials 6.5% 6.1%<br />
Consumer Discretionary 5.0% 4.6%<br />
Consumer Staples 4.0% 3.1%<br />
Health Care 1.0% 1.6%<br />
Financials 31.0% 30.9%<br />
Information Technology 1.5% 1.2%<br />
Telecommunication Services 4.5% 5.2%<br />
Utilities 1.5% 2.1%<br />
Source: <strong>RBC</strong> GAM<br />
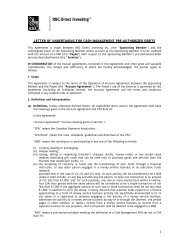
22387<br />
14307<br />
9143<br />
5843<br />
3734<br />
2387<br />
1525<br />
975<br />
623<br />
S&P/TSX COMPOSITE Equilibrium<br />
Normalized Earnings and Valuations<br />
Jun. '12 Range: 10650 - 15897 (Mid: 13273)<br />
Jun. '13 Range: 10729 - 16014 (Mid: 13371)<br />
Current (01-June-12): 11361<br />
SAMPLE<br />
398<br />
1960 1965 1970 1975 1980 1985 1990 1995 2000 2005 2010 2015<br />
Source: <strong>RBC</strong> GAM<br />
medium term for investors who are<br />
basing decisions on our estimate of<br />
normalized earnings capacity. Dividend<br />
yields, free cash flows and corporate<br />
balance sheets are in good shape<br />
and reasonable returns are forecast,<br />
particularly relative to fixed income. In<br />
Canada, we highlight the difference in<br />
the valuation between the largest 60<br />
companies and the broader market. For<br />
years, the valuations of these segments<br />
of the market have marched in<br />
lockstep. Recently, however, valuations<br />
of the larger companies have lagged,<br />
opening up an interesting opportunity.<br />
Price-to-earnings multiples of the<br />
banks are back at the low end of the<br />
trailing 10-year range. Despite decent<br />
second-quarter earnings, consumer<br />
56 I The global investment outlook <strong>RBC</strong> INVESTMENT Strategy coMMITTEE Summer 2012