View Sample PDF - RBC Direct Investing
View Sample PDF - RBC Direct Investing
View Sample PDF - RBC Direct Investing

You also want an ePaper? Increase the reach of your titles
YUMPU automatically turns print PDFs into web optimized ePapers that Google loves.
Currency markets • Dagmara Fijalkowski, MBA, CFA<br />
U.S. dollar didn’t give back much of its<br />
strength.<br />
Why is the dollar a safe haven? Broadly<br />
speaking, because U.S. portfolio<br />
managers invest more money abroad<br />
than foreign investors invest in the<br />
U.S. Exhibit 7 shows a comparison of<br />
net international investment positions<br />
excluding reserve assets and liabilities,<br />
which are considered sticky assets.<br />
The U.S. is one of the three countries<br />
with net exports of investment capital.<br />
However, the other two, Japan and<br />
Switzerland, have been actively trying<br />
to limit the strength of their currencies.<br />
This means that in times of stress,<br />
U.S. investors bring their money home,<br />
strengthening the greenback in the<br />
process.<br />
The euro<br />
Despite the euro’s resilience early<br />
in the year, our base case for the<br />
currency remains bearish. For the time<br />
being, the stress manifests itself in<br />
intra-EMU flows, which lead to the<br />
outperformance of bunds versus bonds<br />
of peripheral countries. We have,<br />
therefore, seen relatively little impact<br />
on the value of the single currency. By<br />
March of this year, yields on 10-year<br />
bunds fell to unprecedented levels<br />
below 1.5%, and yields on 2-year<br />
German notes fell below comparable<br />
securities issued by Japan. We believe<br />
this resilience is temporary. With<br />
Eurozone problems heating up after<br />
the failed Greek elections, the ECB<br />
will likely find itself easing monetary<br />
policy, while the probability of the Fed<br />
engaging in QE3 has declined along<br />
with improvement in the U.S. economy.<br />
Two-year interest rate differentials<br />
reflect these expectations and suggest<br />
the euro will fall further (Exhibit 8).<br />
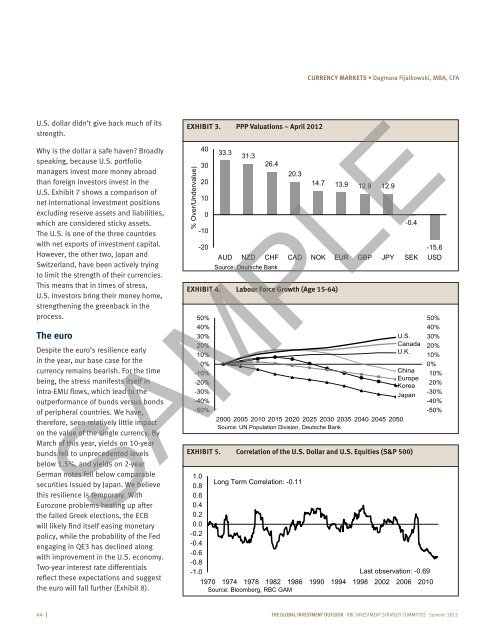
EXHIBIT 3. PPP Valuations – April 2012<br />
% Over/Undervalue)<br />
40<br />
30<br />
20<br />
10<br />
0<br />
-10<br />
-20<br />
50%<br />
40%<br />
30%<br />
20%<br />
10%<br />
0%<br />
-10%<br />
-20%<br />
-30%<br />
-40%<br />
-50%<br />
33.3<br />
31.3<br />
26.4<br />
20.3<br />
EXHIBIT 4. Labour Force Growth (Age 15-64)<br />
14.7 13.9 12.9 12.9<br />
2000 2005 2010 2015 2020 2025 2030 2035 2040 2045 2050<br />
Source: UN Population Division, Deutsche Bank<br />
-0.4<br />
-15.6<br />
AUD NZD CHF CAD NOK EUR GBP JPY SEK USD<br />
Source: Deutsche Bank<br />
U.S.<br />
Canada<br />
U.K.<br />
China<br />
Europe<br />
Korea<br />
Japan<br />
SAMPLE<br />
EXHIBIT 5. Correlation of the U.S. Dollar and U.S. Equities (S&P 500)<br />
1.0<br />
Long Term Correlation: -0.11<br />
0.8<br />
0.6<br />
0.4<br />
0.2<br />
0.0<br />
-0.2<br />
-0.4<br />
-0.6<br />
-0.8<br />
-1.0<br />
Last observation: -0.69<br />
1970 1974 1978 1982 1986 1990 1994 1998 2002 2006 2010<br />
Source: Bloomberg, <strong>RBC</strong> GAM<br />
50%<br />
40%<br />
30%<br />
20%<br />
10%<br />
0%<br />
-10%<br />
-20%<br />
-30%<br />
-40%<br />
-50%<br />
44 I The global investment outlook <strong>RBC</strong> INVESTMENT Strategy coMMITTEE Summer 2012