View Sample PDF - RBC Direct Investing
View Sample PDF - RBC Direct Investing
View Sample PDF - RBC Direct Investing

Create successful ePaper yourself
Turn your PDF publications into a flip-book with our unique Google optimized e-Paper software.
Currency Markets<br />
Dagmara Fijalkowski, MBA, CFA<br />
Head, Global Fixed Income & Currencies (Toronto & London)<br />
<strong>RBC</strong> Global Asset Management Inc.<br />
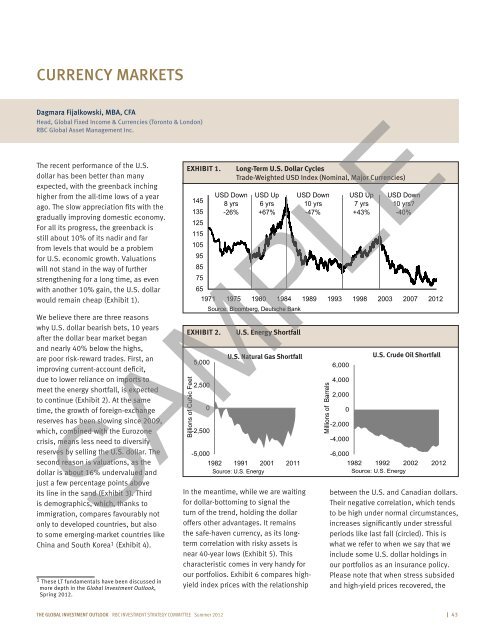
The recent performance of the U.S.<br />
dollar has been better than many<br />
expected, with the greenback inching<br />
higher from the all-time lows of a year<br />
ago. The slow appreciation fits with the<br />
gradually improving domestic economy.<br />
For all its progress, the greenback is<br />
still about 10% of its nadir and far<br />
from levels that would be a problem<br />
for U.S. economic growth. Valuations<br />
will not stand in the way of further<br />
strengthening for a long time, as even<br />
with another 10% gain, the U.S. dollar<br />
would remain cheap (Exhibit 1).<br />
We believe there are three reasons<br />
why U.S. dollar bearish bets, 10 years<br />
after the dollar bear market began<br />
and nearly 40% below the highs,<br />
are poor risk-reward trades. First, an<br />
improving current-account deficit,<br />
due to lower reliance on imports to<br />
meet the energy shortfall, is expected<br />
to continue (Exhibit 2). At the same<br />
time, the growth of foreign-exchange<br />
reserves has been slowing since 2009,<br />
which, combined with the Eurozone<br />
crisis, means less need to diversify<br />
reserves by selling the U.S. dollar. The<br />
second reason is valuations, as the<br />
dollar is about 16% undervalued and<br />
just a few percentage points above<br />
its line in the sand (Exhibit 3). Third<br />
is demographics, which, thanks to<br />
immigration, compares favourably not<br />
only to developed countries, but also<br />
to some emerging-market countries like<br />
China and South Korea 1 (Exhibit 4).<br />
1 These LT fundamentals have been discussed in<br />
more depth in the Global Investment Outlook,<br />
Spring 2012.<br />
EXHIBIT 1.<br />
Billions of Cubic Feet<br />
145<br />
135<br />
125<br />
115<br />
105<br />
95<br />
85<br />
75<br />
65<br />
-2,500<br />
USD Down<br />
8 yrs<br />
-26%<br />
Long-Term U.S. Dollar Cycles<br />
Trade-Weighted USD Index (Nominal, Major Currencies)<br />
USD Up<br />
6 yrs<br />
+67%<br />
USD Down<br />
10 yrs<br />
-47%<br />
USD Up<br />
7 yrs<br />
+43%<br />
USD Down<br />
10 yrs?<br />
-40%<br />
1971 1975 1980 1984 1989 1993 1998 2003 2007 2012<br />
EXHIBIT 2.<br />
5,000<br />
2,500<br />
Source: Bloomberg, Deutsche Bank<br />
0<br />
U.S. Energy Shortfall<br />
U.S. Natural Gas Shortfall<br />
-5,000<br />
1982 1991 2001 2011<br />
Source: U.S. Energy<br />
In the meantime, while we are waiting<br />
for dollar-bottoming to signal the<br />
turn of the trend, holding the dollar<br />
offers other advantages. It remains<br />
the safe-haven currency, as its longterm<br />
correlation with risky assets is<br />
near 40-year lows (Exhibit 5). This<br />
characteristic comes in very handy for<br />
our portfolios. Exhibit 6 compares highyield<br />
index prices with the relationship<br />
Millions of Barrels<br />
6,000<br />
4,000<br />
2,000<br />
0<br />
-2,000<br />
-4,000<br />
U.S. Crude Oil Shortfall<br />
SAMPLE<br />
-6,000<br />
1982 1992 2002 2012<br />
Source: U.S. Energy<br />
between the U.S. and Canadian dollars.<br />
Their negative correlation, which tends<br />
to be high under normal circumstances,<br />
increases significantly under stressful<br />
periods like last fall (circled). This is<br />
what we refer to when we say that we<br />
include some U.S. dollar holdings in<br />
our portfolios as an insurance policy.<br />
Please note that when stress subsided<br />
and high-yield prices recovered, the<br />
The global investment outlook <strong>RBC</strong> INVESTMENT Strategy coMMITTEE Summer 2012 I 43