Note 1 - Beerenberg
Note 1 - Beerenberg
Note 1 - Beerenberg

Create successful ePaper yourself
Turn your PDF publications into a flip-book with our unique Google optimized e-Paper software.
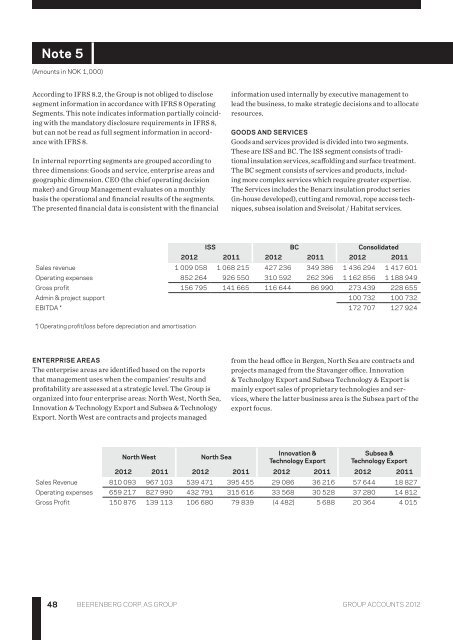
<strong>Note</strong> 5<br />
(Amounts in NOK 1,000)<br />
According to IFRS 8.2, the Group is not obliged to disclose<br />
segment information in accordance with IFRS 8 Operating<br />
Segments. This note indicates information partially coinciding<br />
with the mandatory disclosure requirements in IFRS 8,<br />
but can not be read as full segment information in accordance<br />
with IFRS 8.<br />
In internal reporrting segments are grouped according to<br />
three dimensions: Goods and service, enterprise areas and<br />
geographic dimension. CEO (the chief operating decision<br />
maker) and Group Management evaluates on a monthly<br />
basis the operational and financial results of the segments.<br />
The presented financial data is consistent with the financial<br />
information used internally by executive management to<br />
lead the business, to make strategic decisions and to allocate<br />
resources.<br />
Goods and services<br />
Goods and services provided is divided into two segments.<br />
These are ISS and BC. The ISS segment consists of traditional<br />
insulation services, scaffolding and surface treatment.<br />
The BC segment consists of services and products, including<br />
more complex services which require greater expertise.<br />
The Services includes the Benarx insulation product series<br />
(in-house developed), cutting and removal, rope access techniques,<br />
subsea isolation and Sveisolat / Habitat services.<br />
ISS BC Consolidated<br />
2012 2011 2012 2011 2012 2011<br />
Sales revenue 1 009 058 1 068 215 427 236 349 386 1 436 294 1 417 601<br />
Operating expenses 852 264 926 550 310 592 262 396 1 162 856 1 188 949<br />
Gross profit 156 795 141 665 116 644 86 990 273 439 228 655<br />
Admin & project support 100 732 100 732<br />
EBITDA * 172 707 127 924<br />
*) Operating profit/loss before depreciation and amortisation<br />
Enterprise areas<br />
The enterprise areas are identified based on the reports<br />
that management uses when the companies’ results and<br />
profitability are assessed at a strategic level. The Group is<br />
organized into four enterprise areas: North West, North Sea,<br />
Innovation & Technology Export and Subsea & Technology<br />
Export. North West are contracts and projects managed<br />
from the head office in Bergen, North Sea are contracts and<br />
projects managed from the Stavanger office. Innovation<br />
& Technolgoy Export and Subsea Technology & Export is<br />
mainly export sales of proprietary technologies and services,<br />
where the latter business area is the Subsea part of the<br />
export focus.<br />
North West<br />
North Sea<br />
Innovation &<br />
Technology Export<br />
Subsea &<br />
Technology Export<br />
2012 2011 2012 2011 2012 2011 2012 2011<br />
Sales Revenue 810 093 967 103 539 471 395 455 29 086 36 216 57 644 18 827<br />
Operating expenses 659 217 827 990 432 791 315 616 33 568 30 528 37 280 14 812<br />
Gross Profit 150 876 139 113 106 680 79 839 (4 482) 5 688 20 364 4 015<br />
48<br />
<strong>Beerenberg</strong> CORP. AS Group group accounts 2012