Note 1 - Beerenberg
Note 1 - Beerenberg
Note 1 - Beerenberg

Create successful ePaper yourself
Turn your PDF publications into a flip-book with our unique Google optimized e-Paper software.
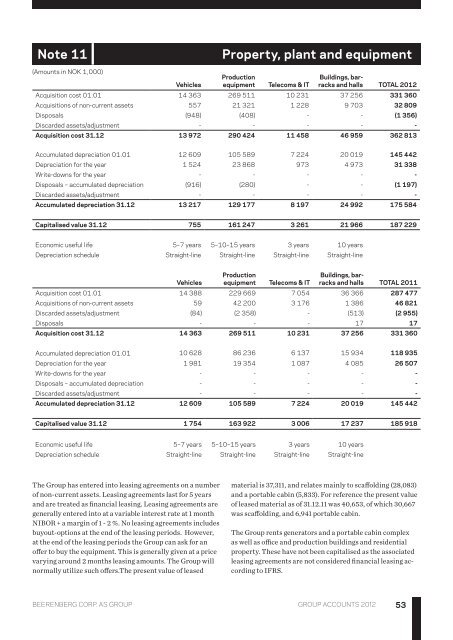
<strong>Note</strong> 11<br />
Property, plant and equipment<br />
(Amounts in NOK 1,000)<br />
Vehicles<br />
Production<br />
equipment<br />
Telecoms & IT<br />
Buildings, barracks<br />
and halls TOTAL 2012<br />
Acquisition cost 01.01 14 363 269 511 10 231 37 256 331 360<br />
Acquisitions of non-current assets 557 21 321 1 228 9 703 32 809<br />
Disposals (948) (408) - - (1 356)<br />
Discarded assets/adjustment - - - - -<br />
Acquisition cost 31.12 13 972 290 424 11 458 46 959 362 813<br />
Accumulated depreciation 01.01 12 609 105 589 7 224 20 019 145 442<br />
Depreciation for the year 1 524 23 868 973 4 973 31 338<br />
Write-downs for the year - - - - -<br />
Disposals – accumulated depreciation (916) (280) - - (1 197)<br />
Discarded assets/adjustment - - - - -<br />
Accumulated depreciation 31.12 13 217 129 177 8 197 24 992 175 584<br />
Capitalised value 31.12 755 161 247 3 261 21 966 187 229<br />
Economic useful life 5–7 years 5–10–15 years 3 years 10 years<br />
Depreciation schedule Straight-line Straight-line Straight-line Straight-line<br />
Vehicles<br />
Production<br />
equipment<br />
Telecoms & IT<br />
Buildings, barracks<br />
and halls TOTAL 2011<br />
Acquisition cost 01.01 14 388 229 669 7 054 36 366 287 477<br />
Acquisitions of non-current assets 59 42 200 3 176 1 386 46 821<br />
Discarded assets/adjustment (84) (2 358) - (513) (2 955)<br />
Disposals - - - 17 17<br />
Acquisition cost 31.12 14 363 269 511 10 231 37 256 331 360<br />
Accumulated depreciation 01.01 10 628 86 236 6 137 15 934 118 935<br />
Depreciation for the year 1 981 19 354 1 087 4 085 26 507<br />
Write-downs for the year - - - - -<br />
Disposals – accumulated depreciation - - - - -<br />
Discarded assets/adjustment - - - - -<br />
Accumulated depreciation 31.12 12 609 105 589 7 224 20 019 145 442<br />
Capitalised value 31.12 1 754 163 922 3 006 17 237 185 918<br />
Economic useful life 5–7 years 5–10–15 years 3 years 10 years<br />
Depreciation schedule Straight-line Straight-line Straight-line Straight-line<br />
The Group has entered into leasing agreements on a number<br />
of non-current assets. Leasing agreements last for 5 years<br />
and are treated as financial leasing. Leasing agreements are<br />
generally entered into at a variable interest rate at 1 month<br />
NIBOR + a margin of 1 - 2 %. No leasing agreements includes<br />
buyout-options at the end of the leasing periods. However,<br />
at the end of the leasing periods the Group can ask for an<br />
offer to buy the equipment. This is generally given at a price<br />
varying around 2 months leasing amounts. The Group will<br />
normally utilize such offers.The present value of leased<br />
material is 37,311, and relates mainly to scaffolding (28,083)<br />
and a portable cabin (5,833). For reference the present value<br />
of leased material as of 31.12.11 was 40,653, of which 30,667<br />
was scaffolding, and 6,941 portable cabin.<br />
The Group rents generators and a portable cabin complex<br />
as well as office and production buildings and residential<br />
property. These have not been capitalised as the associated<br />
leasing agreements are not considered financial leasing according<br />
to IFRS.<br />
<strong>Beerenberg</strong> CORP. AS Group group accounts 2012<br />
53