Vegetation Classification and Mapping Project Report - the USGS
Vegetation Classification and Mapping Project Report - the USGS
Vegetation Classification and Mapping Project Report - the USGS
You also want an ePaper? Increase the reach of your titles
YUMPU automatically turns print PDFs into web optimized ePapers that Google loves.
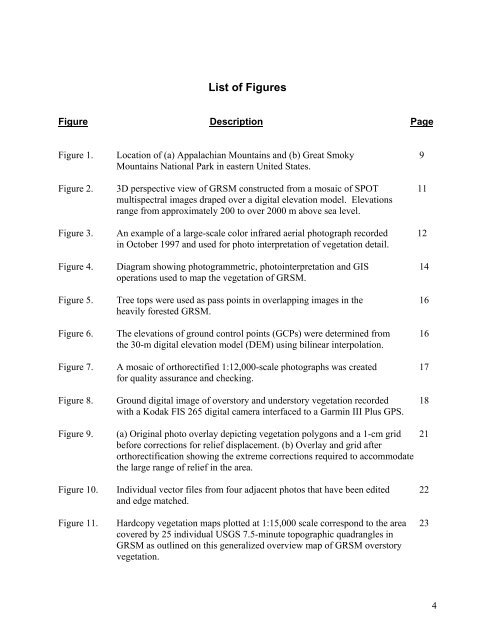
List of Figures<br />
Figure Description Page<br />
Figure 1. Location of (a) Appalachian Mountains <strong>and</strong> (b) Great Smoky 9<br />
Mountains National Park in eastern United States.<br />
Figure 2. 3D perspective view of GRSM constructed from a mosaic of SPOT 11<br />
multispectral images draped over a digital elevation model. Elevations<br />
range from approximately 200 to over 2000 m above sea level.<br />
Figure 3. An example of a large-scale color infrared aerial photograph recorded 12<br />
in October 1997 <strong>and</strong> used for photo interpretation of vegetation detail.<br />
Figure 4. Diagram showing photogrammetric, photointerpretation <strong>and</strong> GIS 14<br />
operations used to map <strong>the</strong> vegetation of GRSM.<br />
Figure 5. Tree tops were used as pass points in overlapping images in <strong>the</strong> 16<br />
heavily forested GRSM.<br />
Figure 6. The elevations of ground control points (GCPs) were determined from 16<br />
<strong>the</strong> 30-m digital elevation model (DEM) using bilinear interpolation.<br />
Figure 7. A mosaic of orthorectified 1:12,000-scale photographs was created 17<br />
for quality assurance <strong>and</strong> checking.<br />
Figure 8. Ground digital image of overstory <strong>and</strong> understory vegetation recorded 18<br />
with a Kodak FIS 265 digital camera interfaced to a Garmin III Plus GPS.<br />
Figure 9. (a) Original photo overlay depicting vegetation polygons <strong>and</strong> a 1-cm grid 21<br />
before corrections for relief displacement. (b) Overlay <strong>and</strong> grid after<br />
orthorectification showing <strong>the</strong> extreme corrections required to accommodate<br />
<strong>the</strong> large range of relief in <strong>the</strong> area.<br />
Figure 10. Individual vector files from four adjacent photos that have been edited 22<br />
<strong>and</strong> edge matched.<br />
Figure 11. Hardcopy vegetation maps plotted at 1:15,000 scale correspond to <strong>the</strong> area 23<br />
covered by 25 individual <strong>USGS</strong> 7.5-minute topographic quadrangles in<br />
GRSM as outlined on this generalized overview map of GRSM overstory<br />
vegetation.<br />
4


