CIFER®-MATLAB Interfaces: Development and ... - Cal Poly
CIFER®-MATLAB Interfaces: Development and ... - Cal Poly
CIFER®-MATLAB Interfaces: Development and ... - Cal Poly

Create successful ePaper yourself
Turn your PDF publications into a flip-book with our unique Google optimized e-Paper software.
La<br />
Length: Lm = [4.14]<br />
N<br />
τ<br />
a<br />
Time Constant: τ<br />
m<br />
= [4.15]<br />
N<br />
Frequency:<br />
ω = N<br />
[4.16]<br />
m<br />
ω a<br />
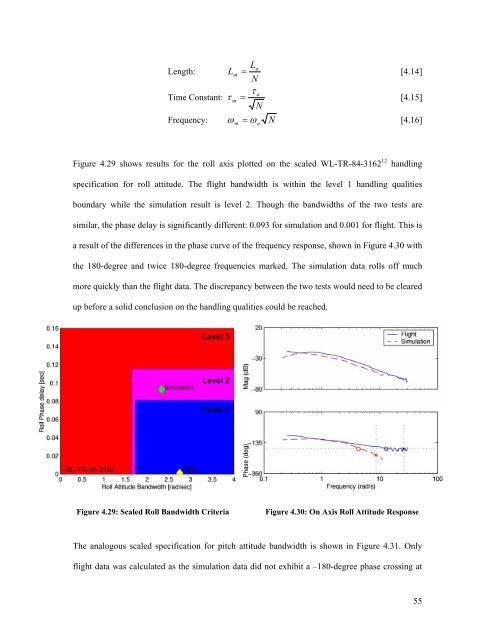
Figure 4.29 shows results for the roll axis plotted on the scaled WL-TR-84-3162 12 h<strong>and</strong>ling<br />
specification for roll attitude. The flight b<strong>and</strong>width is within the level 1 h<strong>and</strong>ling qualities<br />
boundary while the simulation result is level 2. Though the b<strong>and</strong>widths of the two tests are<br />
similar, the phase delay is significantly different: 0.093 for simulation <strong>and</strong> 0.001 for flight. This is<br />
a result of the differences in the phase curve of the frequency response, shown in Figure 4.30 with<br />
the 180-degree <strong>and</strong> twice 180-degree frequencies marked. The simulation data rolls off much<br />
more quickly than the flight data. The discrepancy between the two tests would need to be cleared<br />
up before a solid conclusion on the h<strong>and</strong>ling qualities could be reached.<br />
Level 3<br />
Level 2<br />
Level 1<br />
Figure 4.29: Scaled Roll B<strong>and</strong>width Criteria<br />
Figure 4.30: On Axis Roll Attitude Response<br />
The analogous scaled specification for pitch attitude b<strong>and</strong>width is shown in Figure 4.31. Only<br />
flight data was calculated as the simulation data did not exhibit a –180-degree phase crossing at<br />
55