WASATCH FUNDS - Curian Clearing
WASATCH FUNDS - Curian Clearing
WASATCH FUNDS - Curian Clearing

Create successful ePaper yourself
Turn your PDF publications into a flip-book with our unique Google optimized e-Paper software.
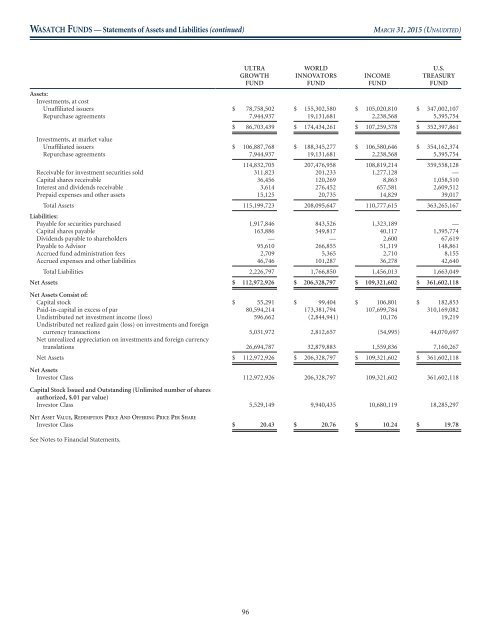
<strong>WASATCH</strong> <strong>FUNDS</strong> — Statements of Assets and Liabilities (continued)<br />
MARCH 31, 2015 (UNAUDITED)<br />
ULTRA<br />
GROWTH<br />
FUND<br />
WORLD<br />
INNOVATORS<br />
FUND<br />
INCOME<br />
FUND<br />
U.S.<br />
TREASURY<br />
FUND<br />
Assets:<br />
Investments, at cost<br />
Unaffiliated issuers $ 78,758,502 $ 155,302,580 $ 105,020,810 $ 347,002,107<br />
Repurchase agreements 7,944,937 19,131,681 2,238,568 5,395,754<br />
$ 86,703,439 $ 174,434,261 $ 107,259,378 $ 352,397,861<br />
Investments, at market value<br />
Unaffiliated issuers $ 106,887,768 $ 188,345,277 $ 106,580,646 $ 354,162,374<br />
Repurchase agreements 7,944,937 19,131,681 2,238,568 5,395,754<br />
114,832,705 207,476,958 108,819,214 359,558,128<br />
Receivable for investment securities sold 311,823 201,233 1,277,128 —<br />
Capital shares receivable 36,456 120,269 8,863 1,058,510<br />
Interest and dividends receivable 3,614 276,452 657,581 2,609,512<br />
Prepaid expenses and other assets 15,125 20,735 14,829 39,017<br />
Total Assets 115,199,723 208,095,647 110,777,615 363,265,167<br />
Liabilities:<br />
Payable for securities purchased 1,917,846 843,526 1,323,189 —<br />
Capital shares payable 163,886 549,817 40,117 1,395,774<br />
Dividends payable to shareholders — — 2,600 67,619<br />
Payable to Advisor 95,610 266,855 51,119 148,861<br />
Accrued fund administration fees 2,709 5,365 2,710 8,155<br />
Accrued expenses and other liabilities 46,746 101,287 36,278 42,640<br />
Total Liabilities 2,226,797 1,766,850 1,456,013 1,663,049<br />
Net Assets $ 112,972,926 $ 206,328,797 $ 109,321,602 $ 361,602,118<br />
Net Assets Consist of:<br />
Capital stock $ 55,291 $ 99,404 $ 106,801 $ 182,853<br />
Paid-in-capital in excess of par 80,594,214 173,381,794 107,699,784 310,169,082<br />
Undistributed net investment income (loss) 596,662 (2,844,941) 10,176 19,219<br />
Undistributed net realized gain (loss) on investments and foreign<br />
currency transactions 5,031,972 2,812,657 (54,995) 44,070,697<br />
Net unrealized appreciation on investments and foreign currency<br />
translations 26,694,787 32,879,883 1,559,836 7,160,267<br />
Net Assets $ 112,972,926 $ 206,328,797 $ 109,321,602 $ 361,602,118<br />
Net Assets<br />
Investor Class 112,972,926 206,328,797 109,321,602 361,602,118<br />
Capital Stock Issued and Outstanding (Unlimited number of shares<br />
authorized, $.01 par value)<br />
Investor Class 5,529,149 9,940,435 10,680,119 18,285,297<br />
NET ASSET VALUE,REDEMPTION PRICE AND OFFERING PRICE PER SHARE<br />
Investor Class $ 20.43 $ 20.76 $ 10.24 $ 19.78<br />
See Notes to Financial Statements.<br />
96