WASATCH FUNDS - Curian Clearing
WASATCH FUNDS - Curian Clearing
WASATCH FUNDS - Curian Clearing

You also want an ePaper? Increase the reach of your titles
YUMPU automatically turns print PDFs into web optimized ePapers that Google loves.
<strong>WASATCH</strong> MICRO CAP VALUE FUND (WAMVX) — Portfolio Summary<br />
MARCH 31, 2015 (UNAUDITED)<br />
AVERAGE ANNUAL TOTAL RETURNS<br />
SIX MONTHS* 1YEAR 5YEARS 10 YEARS<br />
Micro Cap Value 12.29% 4.34% 13.40% 10.64%<br />
Russell Microcap ® Index 14.69% 3.79% 14.69% 7.11%<br />
Russell 2000 ® Index 14.46% 8.21% 14.57% 8.82%<br />
Data shows past performance, which is not indicative of future performance. Current performance may be lower<br />
or higher than the performance quoted. To obtain the most recent month-end performance data available, please<br />
visit www.WasatchFunds.com. The Advisor may absorb certain Fund expenses, without which total return would<br />
have been lower. Investment returns and principal value will fluctuate and shares, when redeemed, may be worth<br />
more or less than their original cost.<br />
As of the January 31, 2015 prospectus, the Total Annual Fund Operating Expenses for the Wasatch Micro<br />
Cap Value Fund are 2.02%. The Net Expenses are 1.95%. The expense ratio shown elsewhere in this report<br />
may be different. Net Expenses are based on Fund expenses, net of waivers and reimbursements. See the<br />
prospectus for additional information regarding Fund expenses.<br />
Wasatch Funds will deduct a 2.00% redemption proceeds fee on Fund shares held 60 days or less. Performance data<br />
does not reflect the deduction of fees, including sales charges, or the taxes you would pay on fund distributions or the<br />
redemption of fund shares. Fees and taxes, if reflected, would reduce the performance quoted. Wasatch does not charge<br />
any sales fees. For more complete information including charges, risks and expenses, read the prospectus carefully.<br />
Investing in micro cap funds will be more volatile and loss of principal could be greater than investing in<br />
large cap or more diversified funds. Investments in value stocks can perform differently from the market as<br />
a whole and from other types of stocks and can continue to be undervalued by the market for long periods<br />
of time. Investing in foreign securities, especially in emerging markets, entails special risks, such as<br />
currency fluctuations and political uncertainties, which are described in more detail in the prospectus.<br />
*Not annualized.<br />
% of Net<br />
Company<br />
Assets<br />
Allegiant Travel Co. 1.7%<br />
Lee’s Pharmaceutical Holdings Ltd. (China) 1.4%<br />
Synergetics USA, Inc. 1.4%<br />
LGI Homes, Inc. 1.4%<br />
Gentherm, Inc. 1.4%<br />
TOP 10 EQUITY HOLDINGS**<br />
% of Net<br />
Company<br />
Assets<br />
Perficient, Inc. 1.4%<br />
Customers Bancorp, Inc. 1.3%<br />
Saia, Inc. 1.3%<br />
Atlas Financial Holdings, Inc. 1.3%<br />
Nu Skin Enterprises, Inc., Class A 1.3%<br />
**As of March 31, 2015, there were 106 holdings in the Fund. Foreign currency contracts, written options and<br />
repurchase agreements, if any, are not included in the number of holdings. Portfolio holdings are subject to<br />
change at any time. References to specific securities should not be construed as recommendations by the Funds<br />
or their Advisor. Current and future holdings are subject to risk.<br />
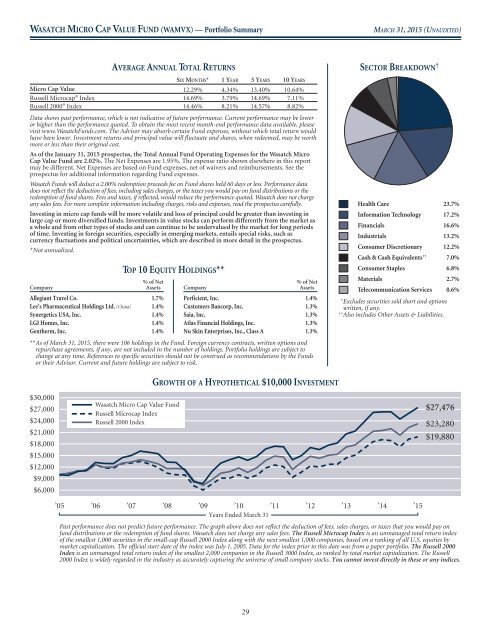
SECTOR BREAKDOWN † 23.7%<br />
Health Care<br />
Information Technology<br />
Financials<br />
Industrials<br />
Consumer Discretionary<br />
17.2%<br />
16.6%<br />
13.2%<br />
12.2%<br />
Cash & Cash Equivalents †† 7.0%<br />
Consumer Staples<br />
6.8%<br />
Materials<br />
Telecommunication Services<br />
† Excludes securities sold short and options<br />
written, if any.<br />
†† Also includes Other Assets & Liabilities.<br />
2.7%<br />
0.6%<br />
$30,000<br />
$27,000<br />
$24,000<br />
$21,000<br />
$18,000<br />
$15,000<br />
$12,000<br />
$9,000<br />
$6,000<br />
GROWTH OF A HYPOTHETICAL $10,000 INVESTMENT<br />
Wasatch Micro Cap Value Fund<br />
Russell Microcap Index<br />
Russell 2000 Index<br />
$27,476<br />
$23,280<br />
$19,880<br />
’05 ’06 ’07 ’08 ’09 ’10 ’11 ’12 ’13 ’14 ’15<br />
Years Ended March 31<br />
Past performance does not predict future performance. The graph above does not reflect the deduction of fees, sales charges, or taxes that you would payon<br />
fund distributions or the redemption of fund shares. Wasatch does not charge any sales fees. The Russell Microcap Index is an unmanaged total return index<br />
of the smallest 1,000 securities in the small-cap Russell 2000 Index along with the next smallest 1,000 companies, based on a ranking of all U.S. equities by<br />
market capitalization. The official start date of the index was July 1, 2005. Data for the index prior to this date was from a paper portfolio. The Russell 2000<br />
Index is an unmanaged total return index of the smallest 2,000 companies in the Russell 3000 Index, as ranked by total market capitalization. The Russell<br />
2000 Index is widely regarded in the industry as accurately capturing the universe of small company stocks. You cannot invest directly in these or any indices.<br />
29