WASATCH FUNDS - Curian Clearing
WASATCH FUNDS - Curian Clearing
WASATCH FUNDS - Curian Clearing

Create successful ePaper yourself
Turn your PDF publications into a flip-book with our unique Google optimized e-Paper software.
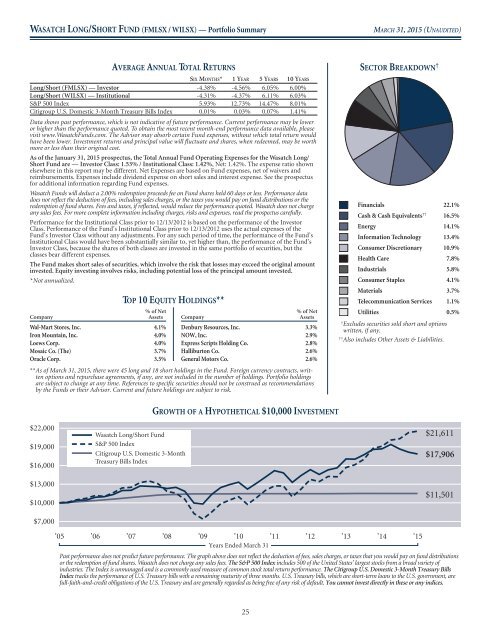
<strong>WASATCH</strong> LONG/SHORT FUND (FMLSX / WILSX) — Portfolio Summary<br />
MARCH 31, 2015 (UNAUDITED)<br />
AVERAGE ANNUAL TOTAL RETURNS<br />
SIX MONTHS* 1YEAR 5YEARS 10 YEARS<br />
Long/Short (FMLSX) — Investor -4.38% -4.56% 6.05% 6.00%<br />
Long/Short (WILSX) — Institutional -4.31% -4.37% 6.11% 6.03%<br />
S&P 500 Index 5.93% 12.73% 14.47% 8.01%<br />
Citigroup U.S. Domestic 3-Month Treasury Bills Index 0.01% 0.03% 0.07% 1.41%<br />
Data shows past performance, which is not indicative of future performance. Current performance may be lower<br />
or higher than the performance quoted. To obtain the most recent month-end performance data available, please<br />
visit www.WasatchFunds.com. The Advisor may absorb certain Fund expenses, without which total return would<br />
have been lower. Investment returns and principal value will fluctuate and shares, when redeemed, may be worth<br />
more or less than their original cost.<br />
As of the January 31, 2015 prospectus, the Total Annual Fund Operating Expenses for the Wasatch Long/<br />
Short Fund are — Investor Class: 1.53% / Institutional Class: 1.42%, Net: 1.42%. The expense ratio shown<br />
elsewhere in this report may be different. Net Expenses are based on Fund expenses, net of waivers and<br />
reimbursements. Expenses include dividend expense on short sales and interest expense. See the prospectus<br />
for additional information regarding Fund expenses.<br />
Wasatch Funds will deduct a 2.00% redemption proceeds fee on Fund shares held 60 days or less. Performance data<br />
does not reflect the deduction of fees, including sales charges, or the taxes you would pay on fund distributions or the<br />
redemption of fund shares. Fees and taxes, if reflected, would reduce the performance quoted. Wasatch does not charge<br />
any sales fees. For more complete information including charges, risks and expenses, read the prospectus carefully.<br />
Performance for the Institutional Class prior to 12/13/2012 is based on the performance of the Investor<br />
Class. Performance of the Fund’s Institutional Class prior to 12/13/2012 uses the actual expenses of the<br />
Fund’s Investor Class without any adjustments. For any such period of time, the performance of the Fund’s<br />
Institutional Class would have been substantially similar to, yet higher than, the performance of the Fund’s<br />
Investor Class, because the shares of both classes are invested in the same portfolio of securities, but the<br />
classes bear different expenses.<br />
The Fund makes short sales of securities, which involve the risk that losses may exceed the original amount<br />
invested. Equity investing involves risks, including potential loss of the principal amount invested.<br />
*Not annualized.<br />
% of Net<br />
Company<br />
Assets<br />
Wal-Mart Stores, Inc. 4.1%<br />
Iron Mountain, Inc. 4.0%<br />
Loews Corp. 4.0%<br />
Mosaic Co. (The) 3.7%<br />
Oracle Corp. 3.5%<br />
TOP 10 EQUITY HOLDINGS**<br />
% of Net<br />
Company<br />
Assets<br />
Denbury Resources, Inc. 3.3%<br />
NOW, Inc. 2.9%<br />
Express Scripts Holding Co. 2.8%<br />
Halliburton Co. 2.6%<br />
General Motors Co. 2.6%<br />
**As of March 31, 2015, there were 45 long and 18 short holdings in the Fund. Foreign currency contracts, written<br />
options and repurchase agreements, if any, are not included in the number of holdings. Portfolio holdings<br />
are subject to change at any time. References to specific securities should not be construed as recommendations<br />
by the Funds or their Advisor. Current and future holdings are subject to risk.<br />
SECTOR BREAKDOWN † 22.1%<br />
Financials<br />
Cash & Cash Equivalents †† 16.5%<br />
Energy<br />
14.1%<br />
Information Technology<br />
Consumer Discretionary<br />
Health Care<br />
Industrials<br />
Consumer Staples<br />
Materials<br />
Telecommunication Services<br />
Utilities<br />
† Excludes securities sold short and options<br />
written, if any.<br />
†† Also includes Other Assets & Liabilities.<br />
13.4%<br />
10.9%<br />
7.8%<br />
5.8%<br />
4.1%<br />
3.7%<br />
1.1%<br />
0.5%<br />
$22,000<br />
$19,000<br />
$16,000<br />
$13,000<br />
$10,000<br />
$7,000<br />
Wasatch Long/Short Fund<br />
S&P 500 Index<br />
Citigroup U.S. Domestic 3-Month<br />
Treasury Bills Index<br />
GROWTH OF A HYPOTHETICAL $10,000 INVESTMENT<br />
$21,611<br />
$17,906<br />
$11,501<br />
’05 ’06 ’07 ’08 ’09 ’10 ’11 ’12 ’13 ’14 ’15<br />
Years Ended March 31<br />
Past performance does not predict future performance. The graph above does not reflect the deduction of fees, sales charges, or taxes that you would pay on fund distributions<br />
or the redemption of fund shares. Wasatch does not charge any sales fees. The S&P 500 Index includes 500 of the United States’ largest stocks from a broad variety of<br />
industries. The Index is unmanaged and is a commonly used measure of common stock total return performance. The Citigroup U.S. Domestic 3-Month Treasury Bills<br />
Index tracks the performance of U.S. Treasury bills with a remaining maturity of three months. U.S. Treasury bills, which are short-term loans to the U.S. government, are<br />
full-faith-and-credit obligations of the U.S. Treasury and are generally regarded as being free of any risk of default. You cannot invest directly in these or any indices.<br />
25