WASATCH FUNDS - Curian Clearing
WASATCH FUNDS - Curian Clearing
WASATCH FUNDS - Curian Clearing

You also want an ePaper? Increase the reach of your titles
YUMPU automatically turns print PDFs into web optimized ePapers that Google loves.
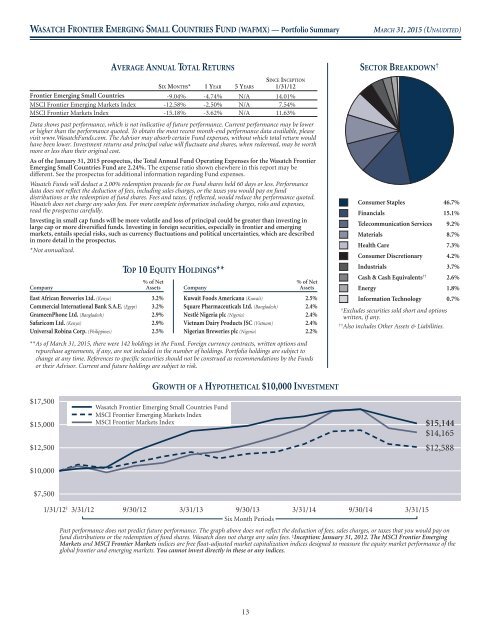
<strong>WASATCH</strong> FRONTIER EMERGING SMALL COUNTRIES FUND (WAFMX) — Portfolio Summary<br />
MARCH 31, 2015 (UNAUDITED)<br />
AVERAGE ANNUAL TOTAL RETURNS<br />
SINCE INCEPTION<br />
SIX MONTHS* 1YEAR 5YEARS 1/31/12<br />
Frontier Emerging Small Countries -9.04% -4.74% N/A 14.01%<br />
MSCI Frontier Emerging Markets Index -12.58% -2.50% N/A 7.54%<br />
MSCI Frontier Markets Index -15.18% -3.62% N/A 11.63%<br />
Data shows past performance, which is not indicative of future performance. Current performance may be lower<br />
or higher than the performance quoted. To obtain the most recent month-end performance data available, please<br />
visit www.WasatchFunds.com. The Advisor may absorb certain Fund expenses, without which total return would<br />
have been lower. Investment returns and principal value will fluctuate and shares, when redeemed, may be worth<br />
more or less than their original cost.<br />
As of the January 31, 2015 prospectus, the Total Annual Fund Operating Expenses for the Wasatch Frontier<br />
Emerging Small Countries Fund are 2.24%. The expense ratio shown elsewhere in this report may be<br />
different. See the prospectus for additional information regarding Fund expenses.<br />
Wasatch Funds will deduct a 2.00% redemption proceeds fee on Fund shares held 60 days or less. Performance<br />
data does not reflect the deduction of fees, including sales charges, or the taxes you would pay on fund<br />
distributions or the redemption of fund shares. Fees and taxes, if reflected, would reduce the performance quoted.<br />
Wasatch does not charge any sales fees. For more complete information including charges, risks and expenses,<br />
read the prospectus carefully.<br />
Investing in small cap funds will be more volatile and loss of principal could be greater than investing in<br />
large cap or more diversified funds. Investing in foreign securities, especially in frontier and emerging<br />
markets, entails special risks, such as currency fluctuations and political uncertainties, which are described<br />
in more detail in the prospectus.<br />
*Not annualized.<br />
% of Net<br />
Company<br />
Assets<br />
East African Breweries Ltd. (Kenya) 3.2%<br />
Commercial International Bank S.A.E. (Egypt) 3.2%<br />
GrameenPhone Ltd. (Bangladesh) 2.9%<br />
Safaricom Ltd. (Kenya) 2.9%<br />
Universal Robina Corp. (Philippines) 2.5%<br />
TOP 10 EQUITY HOLDINGS**<br />
% of Net<br />
Company<br />
Assets<br />
Kuwait Foods Americana (Kuwait) 2.5%<br />
Square Pharmaceuticals Ltd. (Bangladesh) 2.4%<br />
Nestlé Nigeria plc (Nigeria) 2.4%<br />
Vietnam Dairy Products JSC (Vietnam) 2.4%<br />
Nigerian Breweries plc (Nigeria) 2.2%<br />
**As of March 31, 2015, there were 142 holdings in the Fund. Foreign currency contracts, written options and<br />
repurchase agreements, if any, are not included in the number of holdings. Portfolio holdings are subject to<br />
change at any time. References to specific securities should not be construed as recommendations by the Funds<br />
or their Advisor. Current and future holdings are subject to risk.<br />
SECTOR BREAKDOWN † 46.7%<br />
Consumer Staples<br />
Financials<br />
Telecommunication Services<br />
Materials<br />
Health Care<br />
Consumer Discretionary<br />
Industrials<br />
15.1%<br />
9.2%<br />
8.7%<br />
7.3%<br />
4.2%<br />
3.7%<br />
Cash & Cash Equivalents †† 2.6%<br />
Energy<br />
1.8%<br />
Information Technology<br />
† Excludes securities sold short and options<br />
written, if any.<br />
†† Also includes Other Assets & Liabilities.<br />
0.7%<br />
$17,500<br />
$15,000<br />
$12,500<br />
GROWTH OF A HYPOTHETICAL $10,000 INVESTMENT<br />
Wasatch Frontier Emerging Small Countries Fund<br />
MSCI Frontier Emerging Markets Index<br />
MSCI Frontier Markets Index<br />
$15,144<br />
$14,165<br />
$12,588<br />
$10,000<br />
$7,500<br />
1/31/12 ‡ 3/31/12 9/30/12 3/31/13 9/30/13 3/31/14 9/30/14 3/31/15<br />
Six Month Periods<br />
Past performance does not predict future performance. The graph above does not reflect the deduction of fees, sales charges, or taxes that you would payon<br />
fund distributions or the redemption of fund shares. Wasatch does not charge any sales fees. ‡ Inception: January 31, 2012. The MSCI Frontier Emerging<br />
Markets and MSCI Frontier Markets indices are free float-adjusted market capitalization indices designed to measure the equity market performance of the<br />
global frontier and emerging markets. You cannot invest directly in these or any indices.<br />
13