WASATCH FUNDS - Curian Clearing
WASATCH FUNDS - Curian Clearing
WASATCH FUNDS - Curian Clearing

You also want an ePaper? Increase the reach of your titles
YUMPU automatically turns print PDFs into web optimized ePapers that Google loves.
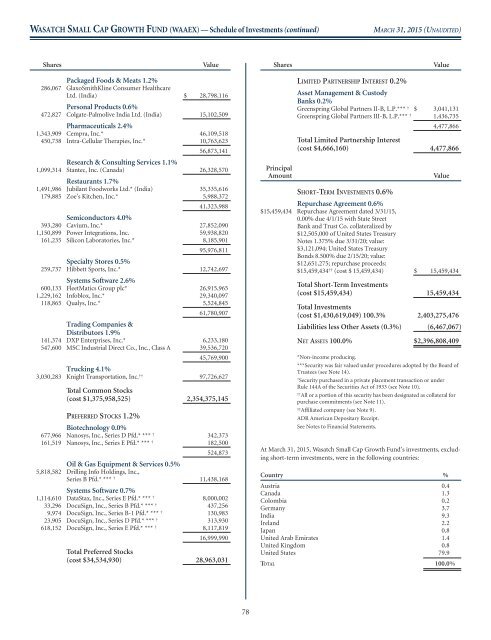
<strong>WASATCH</strong> SMALL CAP GROWTH FUND (WAAEX) — Schedule of Investments (continued)<br />
MARCH 31, 2015 (UNAUDITED)<br />
Shares<br />
Value<br />
Shares<br />
Value<br />
Packaged Foods & Meats 1.2%<br />
286,067 GlaxoSmithKline Consumer Healthcare<br />
Ltd. (India) $ 28,798,116<br />
Personal Products 0.6%<br />
472,827 Colgate-Palmolive India Ltd. (India) 15,102,509<br />
Pharmaceuticals 2.4%<br />
1,343,909 Cempra, Inc.* 46,109,518<br />
450,738 Intra-Cellular Therapies, Inc.* 10,763,623<br />
56,873,141<br />
Research & Consulting Services 1.1%<br />
1,099,314 Stantec, Inc. (Canada) 26,328,570<br />
Restaurants 1.7%<br />
1,491,986 Jubilant Foodworks Ltd.* (India) 35,335,616<br />
179,885 Zoe’s Kitchen, Inc.* 5,988,372<br />
41,323,988<br />
Semiconductors 4.0%<br />
393,280 Cavium, Inc.* 27,852,090<br />
1,150,899 Power Integrations, Inc. 59,938,820<br />
161,235 Silicon Laboratories, Inc.* 8,185,901<br />
95,976,811<br />
Specialty Stores 0.5%<br />
259,737 Hibbett Sports, Inc.* 12,742,697<br />
Systems Software 2.6%<br />
600,133 FleetMatics Group plc* 26,915,965<br />
1,229,162 Infoblox, Inc.* 29,340,097<br />
118,865 Qualys, Inc.* 5,524,845<br />
61,780,907<br />
Trading Companies &<br />
Distributors 1.9%<br />
141,374 DXP Enterprises, Inc.* 6,233,180<br />
547,600 MSC Industrial Direct Co., Inc., Class A 39,536,720<br />
45,769,900<br />
Trucking 4.1%<br />
3,030,283 Knight Transportation, Inc. †† 97,726,627<br />
Total Common Stocks<br />
(cost $1,375,958,525) 2,354,375,145<br />
PREFERRED STOCKS 1.2%<br />
Biotechnology 0.0%<br />
677,966 Nanosys, Inc., Series D Pfd.* *** † 342,373<br />
161,519 Nanosys, Inc., Series E Pfd.* *** † 182,500<br />
524,873<br />
Oil & Gas Equipment & Services 0.5%<br />
5,818,582 Drilling Info Holdings, Inc.,<br />
Series B Pfd.* *** † 11,438,168<br />
Systems Software 0.7%<br />
1,114,610 DataStax, Inc., Series E Pfd.* *** † 8,000,002<br />
33,296 DocuSign, Inc., Series B Pfd.* *** † 437,256<br />
9,974 DocuSign, Inc., Series B-1 Pfd.* *** † 130,983<br />
23,905 DocuSign, Inc., Series D Pfd.* *** † 313,930<br />
618,152 DocuSign, Inc., Series E Pfd.* *** † 8,117,819<br />
16,999,990<br />
Total Preferred Stocks<br />
(cost $34,534,930) 28,963,031<br />
Principal<br />
Amount<br />
LIMITED PARTNERSHIP INTEREST 0.2%<br />
Asset Management & Custody<br />
Banks 0.2%<br />
Greenspring Global Partners II-B, L.P.*** † $ 3,041,131<br />
Greenspring Global Partners III-B, L.P.*** † 1,436,735<br />
4,477,866<br />
Total Limited Partnership Interest<br />
(cost $4,666,160) 4,477,866<br />
Value<br />
SHORT-TERM INVESTMENTS 0.6%<br />
Repurchase Agreement 0.6%<br />
$15,459,434 Repurchase Agreement dated 3/31/15,<br />
0.00% due 4/1/15 with State Street<br />
Bank and Trust Co. collateralized by<br />
$12,505,000 of United States Treasury<br />
Notes 1.375% due 3/31/20; value:<br />
$3,121,094; United States Treasury<br />
Bonds 8.500% due 2/15/20; value:<br />
$12,651,275; repurchase proceeds:<br />
$15,459,434 †† (cost $ 15,459,434) $ 15,459,434<br />
Total Short-Term Investments<br />
(cost $15,459,434) 15,459,434<br />
Total Investments<br />
(cost $1,430,619,049) 100.3% 2,403,275,476<br />
Liabilities less Other Assets (0.3%) (6,467,067)<br />
NET ASSETS 100.0% $2,396,808,409<br />
*Non-income producing.<br />
***Security was fair valued under procedures adopted by the Board of<br />
Trustees (see Note 14).<br />
† Security purchased in a private placement transaction or under<br />
Rule 144A of the Securities Act of 1933 (see Note 10).<br />
†† All or a portion of this security has been designated as collateral for<br />
purchase commitments (see Note 11).<br />
‡‡ Affiliated company (see Note 9).<br />
ADR American Depositary Receipt.<br />
See Notes to Financial Statements.<br />
At March 31, 2015, Wasatch Small Cap Growth Fund’s investments, excluding<br />
short-term investments, were in the following countries:<br />
Country %<br />
Austria 0.4<br />
Canada 1.3<br />
Colombia 0.2<br />
Germany 3.7<br />
India 9.3<br />
Ireland 2.2<br />
Japan 0.8<br />
United Arab Emirates 1.4<br />
United Kingdom 0.8<br />
United States 79.9<br />
TOTAL 100.0%<br />
78