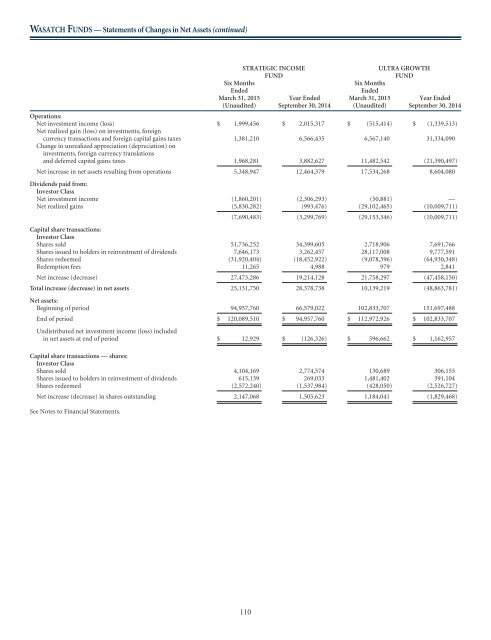
<strong>WASATCH</strong> <strong>FUNDS</strong> — Statements of Changes in Net Assets (continued) Six Months Ended March 31, 2015 (Unaudited) STRATEGIC INCOME FUND Year Ended September 30, 2014 Six Months Ended March 31, 2015 (Unaudited) ULTRA GROWTH FUND Year Ended September 30, 2014 Operations: Net investment income (loss) $ 1,999,456 $ 2,015,317 $ (515,414) $ (1,339,513) Net realized gain (loss) on investments, foreign currency transactions and foreign capital gains taxes 1,381,210 6,566,435 6,567,140 31,334,090 Change in unrealized appreciation (depreciation) on investments, foreign currency translations and deferred capital gains taxes 1,968,281 3,882,627 11,482,542 (21,390,497) Net increase in net assets resulting from operations 5,348,947 12,464,379 17,534,268 8,604,080 Dividends paid from: Investor Class Net investment income (1,860,201) (2,306,293) (50,881) — Net realized gains (5,830,282) (993,476) (29,102,465) (10,009,711) (7,690,483) (3,299,769) (29,153,346) (10,009,711) Capital share transactions: Investor Class Shares sold 51,736,252 34,399,605 2,718,906 7,691,766 Shares issued to holders in reinvestment of dividends 7,646,173 3,262,457 28,117,008 9,777,591 Shares redeemed (31,920,404) (18,452,922) (9,078,596) (64,930,348) Redemption fees 11,265 4,988 979 2,841 Net increase (decrease) 27,473,286 19,214,128 21,758,297 (47,458,150) Total increase (decrease) in net assets 25,131,750 28,378,738 10,139,219 (48,863,781) Net assets: Beginning of period 94,957,760 66,579,022 102,833,707 151,697,488 End of period $ 120,089,510 $ 94,957,760 $ 112,972,926 $ 102,833,707 Undistributed net investment income (loss) included in net assets at end of period $ 12,929 $ (126,326) $ 596,662 $ 1,162,957 Capital share transactions — shares: Investor Class Shares sold 4,104,169 2,774,574 130,689 306,155 Shares issued to holders in reinvestment of dividends 615,139 269,033 1,481,402 391,104 Shares redeemed (2,572,240) (1,537,984) (428,050) (2,526,727) Net increase (decrease) in shares outstanding 2,147,068 1,505,623 1,184,041 (1,829,468) See Notes to Financial Statements. 110
MARCH 31, 2015 (UNAUDITED) Six Months Ended March 31, 2015 (Unaudited) WORLD INNOVATORS FUND Year Ended September 30, 2014 Six Months Ended March 31, 2015 (Unaudited) INCOME FUND Year Ended September 30, 2014 Six Months Ended March 31, 2015 (Unaudited) U.S. TREASURY FUND Year Ended September 30, 2014 $ (989,832) $ (2,638,098) $ 847,940 $ 2,020,770 $ 3,202,460 $ 5,436,735 5,419,063 27,258,295 398,421 79,678 56,268,712 (5,386,264) 1,485,743 (17,034,854) 581,772 132,168 (17,193,815) 26,028,553 5,914,974 7,585,343 1,828,133 2,232,616 42,277,357 26,079,024 — — (844,120) (2,049,307) (3,205,312) (5,436,357) (25,428,998) (14,888,675) — — — — (25,428,998) (14,888,675) (844,120) (2,049,307) (3,205,312) (5,436,357) 14,432,600 94,143,976 6,866,153 15,034,005 162,563,461 80,288,379 23,823,818 13,963,650 828,328 1,993,127 3,091,256 5,215,126 (65,733,250) (114,430,418) (16,110,487) (30,750,807) (67,897,859) (74,727,614) 9,038 25,794 1,416 7,237 109,585 14,175 (27,467,794) (6,296,998) (8,414,590) (13,716,438) 97,866,443 10,790,066 (46,981,818) (13,600,330) (7,430,577) (13,533,129) 136,938,488 31,432,733 253,310,615 266,910,945 116,752,179 130,285,308 224,663,630 193,230,897 $ 206,328,797 $ 253,310,615 $ 109,321,602 $ 116,752,179 $ 361,602,118 $ 224,663,630 $ (2,844,941) $ (1,855,109) $ 10,176 $ 6,356 $ 19,219 $ 22,071 684,431 3,997,947 672,954 1,477,971 8,521,351 5,015,853 1,171,279 595,464 81,178 196,157 159,991 324,073 (3,115,823) (4,922,563) (1,579,226) (3,026,250) (3,548,246) (4,794,925) (1,260,113) (329,152) (825,094) (1,352,122) 5,133,096 545,001 111
- Page 1:
2015 SEMI-ANNUAL REPORT AND QUARTER
- Page 5 and 6:
TABLE OF CONTENTS Letter to Shareho
- Page 7 and 8:
MARCH 31, 2015 (UNAUDITED) Moreover
- Page 9 and 10:
WASATCH CORE GROWTH FUND (WGROX / W
- Page 11 and 12:
WASATCH EMERGING INDIA FUND (WAINX)
- Page 13 and 14:
WASATCH EMERGING MARKETS SELECT FUN
- Page 15 and 16:
WASATCH EMERGING MARKETS SMALL CAP
- Page 17 and 18:
WASATCH FRONTIER EMERGING SMALL COU
- Page 19 and 20:
WASATCH GLOBAL OPPORTUNITIES FUND (
- Page 21 and 22:
WASATCH HERITAGE GROWTH FUND (WAHGX
- Page 23 and 24:
WASATCH INTERNATIONAL GROWTH FUND (
- Page 25 and 26:
WASATCH INTERNATIONAL OPPORTUNITIES
- Page 27 and 28:
WASATCH LARGE CAP VALUE FUND (FMIEX
- Page 29 and 30:
WASATCH LONG/SHORT FUND (FMLSX / WI
- Page 31 and 32:
WASATCH MICRO CAP FUND (WMICX) —
- Page 33 and 34:
WASATCH MICRO CAP VALUE FUND (WAMVX
- Page 35 and 36:
WASATCH SMALL CAP GROWTH FUND (WAAE
- Page 37 and 38:
WASATCH SMALL CAP VALUE FUND (WMCVX
- Page 39 and 40:
WASATCH STRATEGIC INCOME FUND (WASI
- Page 41 and 42:
WASATCH ULTRA GROWTH FUND (WAMCX)
- Page 43 and 44:
WASATCH WORLD INNOVATORS FUND (WAGT
- Page 45 and 46:
WASATCH-1ST SOURCE INCOME FUND (FME
- Page 47 and 48:
WASATCH-HOISINGTON U.S. TREASURY FU
- Page 49 and 50:
WASATCH FUNDS —OPERATING EXPENSES
- Page 51 and 52:
MARCH 31, 2015 (UNAUDITED) Fund/Cla
- Page 53 and 54:
MARCH 31, 2015 (UNAUDITED) Shares V
- Page 55 and 56:
MARCH 31, 2015 (UNAUDITED) Shares V
- Page 57 and 58:
MARCH 31, 2015 (UNAUDITED) At March
- Page 59 and 60:
MARCH 31, 2015 (UNAUDITED) Shares V
- Page 61 and 62:
WASATCH FRONTIER EMERGING SMALL COU
- Page 63 and 64: MARCH 31, 2015 (UNAUDITED) Principa
- Page 65 and 66: MARCH 31, 2015 (UNAUDITED) Shares V
- Page 67 and 68: WASATCH INTERNATIONAL GROWTH FUND (
- Page 69 and 70: WASATCH INTERNATIONAL OPPORTUNITIES
- Page 71 and 72: MARCH 31, 2015 (UNAUDITED) Shares V
- Page 73 and 74: WASATCH LARGE CAP VALUE FUND (FMIEX
- Page 75 and 76: MARCH 31, 2015 (UNAUDITED) Principa
- Page 77 and 78: MARCH 31, 2015 (UNAUDITED) Shares V
- Page 79 and 80: MARCH 31, 2015 (UNAUDITED) Shares V
- Page 81 and 82: WASATCH SMALL CAP GROWTH FUND (WAAE
- Page 83 and 84: WASATCH SMALL CAP VALUE FUND (WMCVX
- Page 85 and 86: WASATCH STRATEGIC INCOME FUND (WASI
- Page 87 and 88: WASATCH ULTRA GROWTH FUND (WAMCX)
- Page 89 and 90: WASATCH WORLD INNOVATORS FUND (WAGT
- Page 91 and 92: WASATCH-1ST SOURCE INCOME FUND (FME
- Page 93 and 94: MARCH 31, 2015 (UNAUDITED) Shares V
- Page 95 and 96: (This page intentionally left blank
- Page 97 and 98: MARCH 31, 2015 (UNAUDITED) EMERGING
- Page 99 and 100: MARCH 31, 2015 (UNAUDITED) MICRO CA
- Page 101 and 102: (This page intentionally left blank
- Page 103 and 104: FOR THE SIX MONTHS ENDED MARCH 31,
- Page 105 and 106: FOR THE SIX MONTHS ENDED MARCH 31,
- Page 107 and 108: (This page intentionally left blank
- Page 109 and 110: MARCH 31, 2015 (UNAUDITED) Six Mont
- Page 111 and 112: MARCH 31, 2015 (UNAUDITED) INTERNAT
- Page 113: MARCH 31, 2015 (UNAUDITED) Six Mont
- Page 117 and 118: (for a share outstanding throughout
- Page 119 and 120: (for a share outstanding throughout
- Page 121 and 122: (for a share outstanding throughout
- Page 123 and 124: WASATCH FUNDS — Notes to Financia
- Page 125 and 126: MARCH 31, 2015 (UNAUDITED) option t
- Page 127 and 128: MARCH 31, 2015 (UNAUDITED) The Fund
- Page 129 and 130: MARCH 31, 2015 (UNAUDITED) Affiliat
- Page 131 and 132: MARCH 31, 2015 (UNAUDITED) 12. LINE
- Page 133 and 134: MARCH 31, 2015 (UNAUDITED) Short-Te
- Page 135 and 136: MARCH 31, 2015 (UNAUDITED) Fund Cat
- Page 137 and 138: MARCH 31, 2015 (UNAUDITED) Fund Mar
- Page 139 and 140: MARCH 31, 2015 (UNAUDITED) 16. FAIR
- Page 141 and 142: WASATCH FUNDS — Supplemental Info
- Page 143 and 144: MARCH 31, 2015 (UNAUDITED) PROXY VO
- Page 145 and 146: MARCH 31, 2015 (UNAUDITED) Independ
- Page 147 and 148: MARCH 31, 2015 (UNAUDITED) In their
- Page 149 and 150: MARCH 31, 2015 (UNAUDITED) affiliat
- Page 152: 5 www.WasatchFunds.com 800.551.1700