WASATCH FUNDS - Curian Clearing
WASATCH FUNDS - Curian Clearing
WASATCH FUNDS - Curian Clearing

Create successful ePaper yourself
Turn your PDF publications into a flip-book with our unique Google optimized e-Paper software.
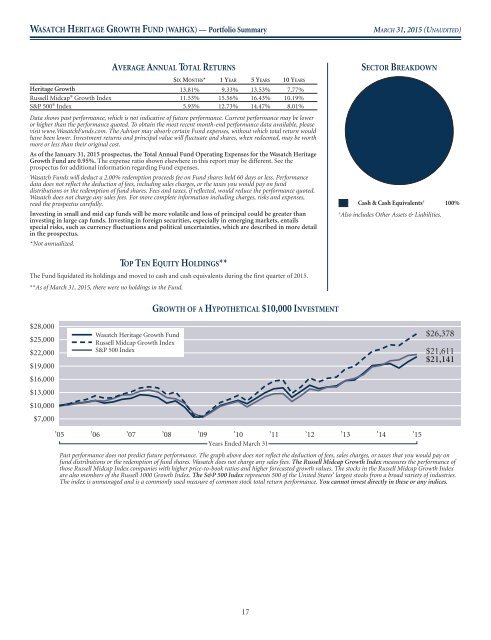
<strong>WASATCH</strong> HERITAGE GROWTH FUND (WAHGX) — Portfolio Summary<br />
MARCH 31, 2015 (UNAUDITED)<br />
AVERAGE ANNUAL TOTAL RETURNS<br />
SIX MONTHS* 1YEAR 5YEARS 10 YEARS<br />
Heritage Growth 13.81% 9.33% 13.53% 7.77%<br />
Russell Midcap ® Growth Index 11.53% 15.56% 16.43% 10.19%<br />
S&P 500 ® Index 5.93% 12.73% 14.47% 8.01%<br />
Data shows past performance, which is not indicative of future performance. Current performance may be lower<br />
or higher than the performance quoted. To obtain the most recent month-end performance data available, please<br />
visit www.WasatchFunds.com. The Advisor may absorb certain Fund expenses, without which total return would<br />
have been lower. Investment returns and principal value will fluctuate and shares, when redeemed, may be worth<br />
more or less than their original cost.<br />
As of the January 31, 2015 prospectus, the Total Annual Fund Operating Expenses for the Wasatch Heritage<br />
Growth Fund are 0.95%. The expense ratio shown elsewhere in this report may be different. See the<br />
prospectus for additional information regarding Fund expenses.<br />
Wasatch Funds will deduct a 2.00% redemption proceeds fee on Fund shares held 60 days or less. Performance<br />
data does not reflect the deduction of fees, including sales charges, or the taxes you would pay on fund<br />
distributions or the redemption of fund shares. Fees and taxes, if reflected, would reduce the performance quoted.<br />
Wasatch does not charge any sales fees. For more complete information including charges, risks and expenses,<br />
read the prospectus carefully.<br />
Investing in small and mid cap funds will be more volatile and loss of principal could be greater than<br />
investing in large cap funds. Investing in foreign securities, especially in emerging markets, entails<br />
special risks, such as currency fluctuations and political uncertainties, which are described in more detail<br />
in the prospectus.<br />
*Not annualized.<br />
SECTOR BREAKDOWN<br />
Cash & Cash Equivalents † 100%<br />
† Also includes Other Assets & Liabilities.<br />
TOP TEN EQUITY HOLDINGS**<br />
The Fund liquidated its holdings and moved to cash and cash equivalents during the first quarter of 2015.<br />
**As of March 31, 2015, there were no holdings in the Fund.<br />
GROWTH OF A HYPOTHETICAL $10,000 INVESTMENT<br />
$28,000<br />
$25,000<br />
$22,000<br />
$19,000<br />
$16,000<br />
$13,000<br />
$10,000<br />
$7,000<br />
Wasatch Heritage Growth Fund<br />
Russell Midcap Growth Index<br />
S&P 500 Index<br />
$26,378<br />
$21,611<br />
$21,141<br />
’05 ’06 ’07 ’08 ’09 ’10 ’11 ’12 ’13 ’14 ’15<br />
Years Ended March 31<br />
Past performance does not predict future performance. The graph above does not reflect the deduction of fees, sales charges, or taxes that you would payon<br />
fund distributions or the redemption of fund shares. Wasatch does not charge any sales fees. The Russell Midcap Growth Index measures the performance of<br />
those Russell Midcap Index companies with higher price-to-book ratios and higher forecasted growth values. The stocks in the Russell Midcap Growth Index<br />
are also members of the Russell 1000 Growth Index. The S&P 500 Index represents 500 of the United States’ largest stocks from a broad variety of industries.<br />
The index is unmanaged and is a commonly used measure of common stock total return performance. You cannot invest directly in these or any indices.<br />
17