WASATCH FUNDS - Curian Clearing
WASATCH FUNDS - Curian Clearing
WASATCH FUNDS - Curian Clearing

You also want an ePaper? Increase the reach of your titles
YUMPU automatically turns print PDFs into web optimized ePapers that Google loves.
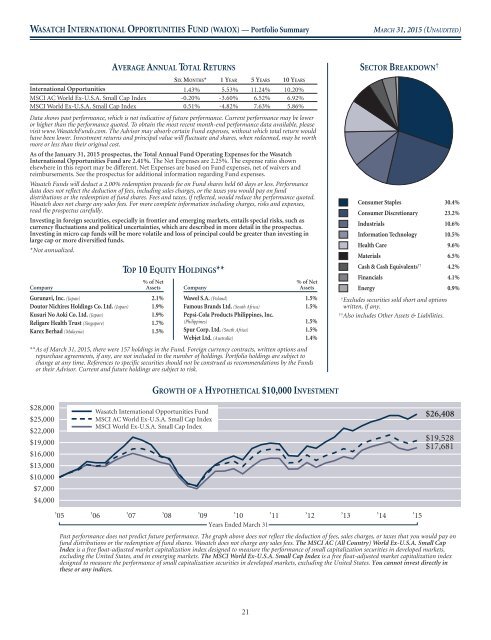
<strong>WASATCH</strong> INTERNATIONAL OPPORTUNITIES FUND (WAIOX) — Portfolio Summary<br />
MARCH 31, 2015 (UNAUDITED)<br />
AVERAGE ANNUAL TOTAL RETURNS<br />
SIX MONTHS* 1YEAR 5YEARS 10 YEARS<br />
International Opportunities 1.43% 5.53% 11.24% 10.20%<br />
MSCI AC World Ex-U.S.A. Small Cap Index -0.20% -3.60% 6.52% 6.92%<br />
MSCI World Ex-U.S.A. Small Cap Index 0.51% -4.82% 7.63% 5.86%<br />
Data shows past performance, which is not indicative of future performance. Current performance may be lower<br />
or higher than the performance quoted. To obtain the most recent month-end performance data available, please<br />
visit www.WasatchFunds.com. The Advisor may absorb certain Fund expenses, without which total return would<br />
have been lower. Investment returns and principal value will fluctuate and shares, when redeemed, may be worth<br />
more or less than their original cost.<br />
As of the January 31, 2015 prospectus, the Total Annual Fund Operating Expenses for the Wasatch<br />
International Opportunities Fund are 2.41%. The Net Expenses are 2.25%. The expense ratio shown<br />
elsewhere in this report may be different. Net Expenses are based on Fund expenses, net of waivers and<br />
reimbursements. See the prospectus for additional information regarding Fund expenses.<br />
Wasatch Funds will deduct a 2.00% redemption proceeds fee on Fund shares held 60 days or less. Performance<br />
data does not reflect the deduction of fees, including sales charges, or the taxes you would pay on fund<br />
distributions or the redemption of fund shares. Fees and taxes, if reflected, would reduce the performance quoted.<br />
Wasatch does not charge any sales fees. For more complete information including charges, risks and expenses,<br />
read the prospectus carefully.<br />
Investing in foreign securities, especially in frontier and emerging markets, entails special risks, such as<br />
currency fluctuations and political uncertainties, which are described in more detail in the prospectus.<br />
Investing in micro cap funds will be more volatile and loss of principal could be greater than investing in<br />
large cap or more diversified funds.<br />
*Not annualized.<br />
% of Net<br />
Company<br />
Assets<br />
Gurunavi, Inc. (Japan) 2.1%<br />
Doutor Nichires Holdings Co. Ltd. (Japan) 1.9%<br />
Kusuri No Aoki Co. Ltd. (Japan) 1.9%<br />
Religare Health Trust (Singapore) 1.7%<br />
Karex Berhad (Malaysia) 1.5%<br />
TOP 10 EQUITY HOLDINGS**<br />
% of Net<br />
Company<br />
Assets<br />
Wawel S.A. (Poland) 1.5%<br />
Famous Brands Ltd. (South Africa) 1.5%<br />
Pepsi-Cola Products Philippines, Inc.<br />
(Philippines) 1.5%<br />
Spur Corp. Ltd. (South Africa) 1.5%<br />
Webjet Ltd. (Australia) 1.4%<br />
**As of March 31, 2015, there were 157 holdings in the Fund. Foreign currency contracts, written options and<br />
repurchase agreements, if any, are not included in the number of holdings. Portfolio holdings are subject to<br />
change at any time. References to specific securities should not be construed as recommendations by the Funds<br />
or their Advisor. Current and future holdings are subject to risk.<br />
SECTOR BREAKDOWN †<br />
Consumer Staples<br />
30.4%<br />
Consumer Discretionary<br />
23.2%<br />
Industrials<br />
10.6%<br />
Information Technology<br />
10.5%<br />
Health Care<br />
9.6%<br />
Materials<br />
6.5%<br />
Cash & Cash Equivalents †† 4.2%<br />
Financials<br />
4.1%<br />
Energy<br />
0.9%<br />
† Excludes securities sold short and options<br />
written, if any.<br />
†† Also includes Other Assets & Liabilities.<br />
$28,000<br />
$25,000<br />
$22,000<br />
$19,000<br />
$16,000<br />
$13,000<br />
$10,000<br />
$7,000<br />
$4,000<br />
GROWTH OF A HYPOTHETICAL $10,000 INVESTMENT<br />
Wasatch International Opportunities Fund<br />
MSCI AC World Ex-U.S.A. Small Cap Index<br />
MSCI World Ex-U.S.A. Small Cap Index<br />
$26,408<br />
$19,528<br />
$17,681<br />
’05 ’06 ’07 ’08 ’09 ’10 ’11 ’12 ’13 ’14 ’15<br />
Years Ended March 31<br />
Past performance does not predict future performance. The graph above does not reflect the deduction of fees, sales charges, or taxes that you would payon<br />
fund distributions or the redemption of fund shares. Wasatch does not charge any sales fees. The MSCI AC (All Country) World Ex-U.S.A. Small Cap<br />
Index is a free float-adjusted market capitalization index designed to measure the performance of small capitalization securities in developed markets,<br />
excluding the United States, and in emerging markets. The MSCI World Ex-U.S.A. Small Cap Index is a free float-adjusted market capitalization index<br />
designed to measure the performance of small capitalization securities in developed markets, excluding the United States. You cannot invest directly in<br />
these or any indices.<br />
21