WASATCH FUNDS - Curian Clearing
WASATCH FUNDS - Curian Clearing
WASATCH FUNDS - Curian Clearing

Create successful ePaper yourself
Turn your PDF publications into a flip-book with our unique Google optimized e-Paper software.
<strong>WASATCH</strong> EMERGING INDIA FUND (WAINX) — Portfolio Summary<br />
MARCH 31, 2015 (UNAUDITED)<br />
AVERAGE ANNUAL TOTAL RETURNS<br />
SINCE INCEPTION<br />
SIX MONTHS* 1YEAR 5YEARS 4/26/11<br />
Emerging India 14.35% 43.20% N/A 12.26%<br />
MSCI India IMI 5.93% 24.14% N/A 1.12%<br />
Data shows past performance, which is not indicative of future performance. Current performance may be lower<br />
or higher than the performance quoted. To obtain the most recent month-end performance data available, please<br />
visit www.WasatchFunds.com. The Advisor may absorb certain Fund expenses, without which total return would<br />
have been lower. Investment returns and principal value will fluctuate and shares, when redeemed, may be worth<br />
more or less than their original cost.<br />
As of the January 31, 2015 prospectus, the Total Annual Fund Operating Expenses for the Wasatch<br />
Emerging India Fund are 2.57%. The Net Expenses are 1.95%. The expense ratio shown elsewhere in this<br />
report may be different. Net Expenses are based on Fund expenses, net of waivers and reimbursements. See<br />
the prospectus for additional information regarding Fund expenses.<br />
Wasatch Funds will deduct a 2.00% redemption proceeds fee on Fund shares held 60 days or less. Performance data<br />
does not reflect the deduction of fees, including sales charges, or the taxes you would pay on fund distributions or the<br />
redemption of fund shares. Fees and taxes, if reflected, would reduce the performance quoted. Wasatch does not charge<br />
any sales fees. For more complete information including charges, risks and expenses, read the prospectus carefully.<br />
Investing in small cap funds will be more volatile and loss of principal could be greater than investing in large<br />
cap or more diversified funds. Investing in foreign securities, especially in emerging markets, entails special risks,<br />
such as currency fluctuations and political uncertainties, which are described in more detail in the prospectus.<br />
*Not annualized.<br />
% of Net<br />
Company<br />
Assets<br />
Cognizant Technology Solutions Corp., Class A 3.2%<br />
Natco Pharma Ltd. (India) 3.2%<br />
HCL Technologies Ltd. (India) 3.0%<br />
Glenmark Pharmaceuticals Ltd. (India) 2.9%<br />
MakeMyTrip Ltd. (India) 2.6%<br />
TOP 10 EQUITY HOLDINGS**<br />
% of Net<br />
Company<br />
Assets<br />
Marksans Pharma Ltd. (India) 2.6%<br />
Axis Bank Ltd. (India) 2.6%<br />
Repco Home Finance Ltd. (India) 2.5%<br />
Lupin Ltd. (India) 2.5%<br />
Bajaj Finance Ltd. (India) 2.2%<br />
**As of March 31, 2015, there were 84 holdings in the Fund. Foreign currency contracts, written options and<br />
repurchase agreements, if any, are not included in the number of holdings. Portfolio holdings are subject to<br />
change at any time. References to specific securities should not be construed as recommendations by the Funds<br />
or their Advisor. Current and future holdings are subject to risk.<br />
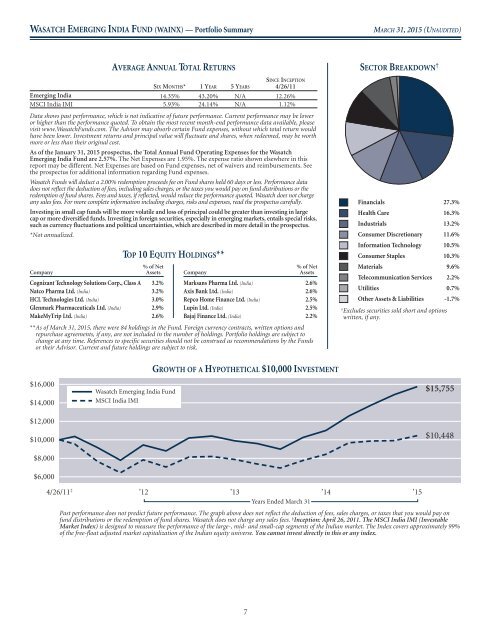
SECTOR BREAKDOWN †<br />
Financials<br />
27.3%<br />
Health Care<br />
16.3%<br />
Industrials<br />
13.2%<br />
Consumer Discretionary 11.6%<br />
Information Technology 10.5%<br />
Consumer Staples<br />
10.3%<br />
Materials<br />
9.6%<br />
Telecommunication Services 2.2%<br />
Utilities<br />
0.7%<br />
Other Assets & Liabilities -1.7%<br />
† Excludes securities sold short and options<br />
written, if any.<br />
$16,000<br />
$14,000<br />
$12,000<br />
$10,000<br />
$8,000<br />
$6,000<br />
Wasatch Emerging India Fund<br />
MSCI India IMI<br />
GROWTH OF A HYPOTHETICAL $10,000 INVESTMENT<br />
$15,755<br />
$10,448<br />
4/26/11 ‡ ’12 ’13 ’14<br />
’15<br />
Years Ended March 31<br />
Past performance does not predict future performance. The graph above does not reflect the deduction of fees, sales charges, or taxes that you would payon<br />
fund distributions or the redemption of fund shares. Wasatch does not charge any sales fees. ‡ Inception: April 26, 2011. The MSCI India IMI (Investable<br />
Market Index) is designed to measure the performance of the large-, mid- and small-cap segments of the Indian market. The Index covers approximately 99%<br />
of the free-float adjusted market capitalization of the Indian equity universe. You cannot invest directly in this or any index.<br />
7