

National Survey of Fishing, Hunting, and Wildlife ... - All About Birds
National Survey of Fishing, Hunting, and Wildlife ... - All About Birds
National Survey of Fishing, Hunting, and Wildlife ... - All About Birds

You also want an ePaper? Increase the reach of your titles
YUMPU automatically turns print PDFs into web optimized ePapers that Google loves.
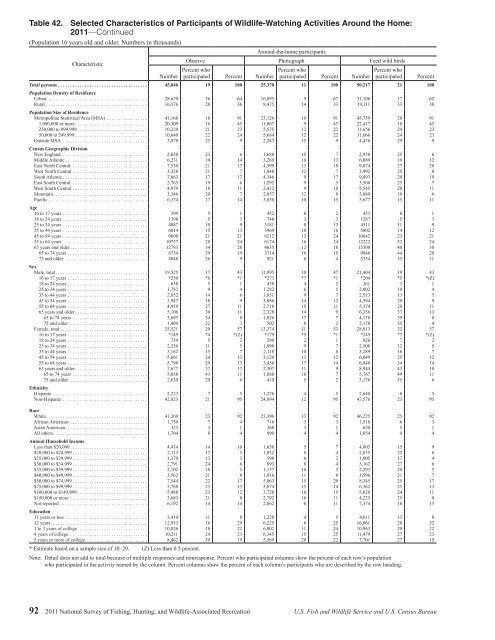
Table 42. Selected Characteristics <strong>of</strong> Participants <strong>of</strong> <strong>Wildlife</strong>-Watching Activities Around the Home:2011—Continued(Population 16 years old <strong>and</strong> older. Numbers in thous<strong>and</strong>s)CharacteristicNumberAround-the-home participantsObserve Photograph Feed wild birdsPercent whoparticipated Percent NumberPercent whoparticipated Percent NumberPercent whoparticipatedTotal persons ..................................... 45,046 19 100 25,370 11 100 50,217 21 100Population Density <strong>of</strong> ResidenceUrban .......................................... 28,670 16 64 16,895 9 67 31,106 17 62Rural .......................................... 16,376 28 36 8,475 14 33 19,111 33 38Population Size <strong>of</strong> ResidenceMetropolitan Statistical Area (MSA) ................. 41,168 18 91 23,126 10 91 45,739 20 911,000,000 or more .............................. 20,309 16 45 11,867 9 47 22,417 18 45250,000 to 999,999 ............................. 10,220 21 23 5,575 12 22 11,656 24 2350,000 to 249,999 .............................. 10,640 22 24 5,684 12 22 11,666 24 23Outside MSA .................................... 3,878 25 9 2,243 15 9 4,478 29 9Census Geographic DivisionNew Engl<strong>and</strong> .................................... 2,630 23 6 1,688 15 7 2,938 25 6Middle Atlantic .................................. 6,231 19 14 3,269 10 13 6,089 19 12East North Central ................................ 7,530 21 17 4,599 13 18 9,874 27 20West North Central ............................... 3,328 21 7 1,848 12 7 3,992 25 8South Atlantic ................................... 7,863 17 17 4,346 9 17 9,493 20 19East South Central ................................ 2,765 19 6 1,292 9 5 3,560 25 7West South Central ............................... 4,979 18 11 2,412 9 10 5,545 20 11Mountain ....................................... 3,346 20 7 2,057 12 8 3,049 18 6Pacific ......................................... 6,374 17 14 3,858 10 15 5,677 15 11Age16 to 17 years ................................... 399 5 1 452 6 2 453 6 118 to 24 years ................................... 1398 5 3 748 3 3 1287 5 325 to 34 years ................................... 4087 10 9 3181 8 13 4511 11 935 to 44 years ................................... 6014 15 13 3969 10 16 5802 14 1245 to 54 years ................................... 9608 21 21 6212 13 24 10642 23 2155 to 64 years ................................... 10757 28 24 6174 16 24 12222 32 2465 years <strong>and</strong> older ................................ 12783 34 28 4635 12 18 15300 40 3065 to 74 years ................................. 8734 39 19 3714 16 15 9946 44 2075 <strong>and</strong> older ................................... 4048 26 9 921 6 4 5354 35 11SexMale, total ...................................... 19,525 17 43 11,995 10 47 21,404 19 4316 to 17 years ................................. *250 *6 *1 *273 *7 *1 *204 *5 *(Z)18 to 24 years ................................. 658 5 1 458 4 2 361 3 125 to 34 years ................................. 1,752 9 4 1,282 6 5 2,002 10 435 to 44 years ................................. 2,852 14 6 1,851 9 7 2,513 13 545 to 54 years ................................. 3,947 18 9 3,086 14 12 4,594 20 955 to 64 years ................................. 4,959 27 11 2,718 15 11 5,374 29 1165 years <strong>and</strong> older .............................. 5,106 30 11 2,328 14 9 6,356 37 1365 to 74 years ............................... 3,697 34 8 1,826 17 7 4,178 39 875 <strong>and</strong> older ................................. 1,409 22 3 502 8 2 2,178 35 4Female, total .................................... 25,521 20 57 13,374 11 53 28,813 23 5716 to 17 years ................................. *149 *4 *(Z) *179 *5 *1 *249 *7 *(Z)18 to 24 years ................................. 739 5 2 290 2 1 926 7 225 to 34 years ................................. 2,336 11 5 1,898 9 7 2,508 12 535 to 44 years ................................. 3,162 15 7 2,118 10 8 3,289 16 745 to 54 years ................................. 5,661 24 13 3,126 13 12 6,049 25 1255 to 64 years ................................. 5,798 29 13 3,456 17 14 6,848 34 1465 years <strong>and</strong> older .............................. 7,677 37 17 2,307 11 9 8,944 43 1865 to 74 years ............................... 5,038 43 11 1,888 16 7 5,767 49 1175 <strong>and</strong> older ................................. 2,639 29 6 419 5 2 3,176 35 6EthnicityHispanic ....................................... 2,223 7 5 1,276 4 5 2,640 8 5Non-Hispanic ................................... 42,823 21 95 24,094 12 95 47,576 23 95RaceWhite .......................................... 41,269 23 92 23,396 13 92 46,225 25 92African American ................................ 1,750 7 4 716 3 3 1,518 6 3Asian American .................................. 323 3 1 368 3 1 620 5 1<strong>All</strong> others ....................................... 1,704 8 4 890 4 4 1,854 9 4Annual Household IncomeLess than $20,000 ................................ 4,414 14 10 1,656 5 7 4,603 15 9$20,000 to $24,999 ............................... 2,113 17 5 1,032 8 4 2,835 22 6$25,000 to $29,999 ............................... 1,370 13 3 598 6 2 1,805 17 4$30,000 to $34,999 ............................... 2,791 24 6 893 8 4 3,162 27 6$35,000 to $39,999 ............................... 2,102 18 5 1,157 10 5 2,293 20 5$40,000 to $49,999 ............................... 3,562 21 8 1,916 11 8 3,596 21 7$50,000 to $74,999 ............................... 7,544 22 17 5,063 15 20 8,345 25 17$75,000 to $99,999 ............................... 5,788 23 13 3,674 15 14 6,362 25 13$100,000 to $149,999 ............................. 5,488 23 12 3,728 16 15 5,620 24 11$150,000 or more ................................ 3,683 21 8 2,792 16 11 4,223 25 8Not reported .................................... 6,192 14 14 2,862 6 11 7,374 16 15Education11 years or less .................................. 3,414 11 8 1,228 4 5 4,011 13 812 years ........................................ 12,933 16 29 6,225 8 25 16,061 20 321 to 3 years <strong>of</strong> college ............................. 10,026 18 22 6,002 11 24 10,963 20 224 years <strong>of</strong> college ................................ 10,211 24 23 6,345 15 25 11,479 27 235 years or more <strong>of</strong> college .......................... 8,462 30 19 5,569 20 22 7,701 27 15* Estimate based on a sample size <strong>of</strong> 10–29. (Z) Less than 0.5 percent.Note: Detail does not add to total because <strong>of</strong> multiple responses <strong>and</strong> nonresponse. Percent who participated columns show the percent <strong>of</strong> each row’s populationwho participated in the activity named by the column. Percent columns show the percent <strong>of</strong> each column’s participants who are described by the row heading.Percent92 2011 <strong>National</strong> <strong>Survey</strong> <strong>of</strong> <strong>Fishing</strong>, <strong>Hunting</strong>, <strong>and</strong> <strong>Wildlife</strong>-Associated Recreation U.S. Fish <strong>and</strong> <strong>Wildlife</strong> Service <strong>and</strong> U.S. Census Bureau


