Table 42. Selected Characteristics <strong>of</strong> Participants <strong>of</strong> <strong>Wildlife</strong>-Watching Activities Around the Home:2011—Continued(Population 16 years old <strong>and</strong> older. Numbers in thous<strong>and</strong>s)CharacteristicNumberAround-the-home participantsObserve Photograph Feed wild birdsPercent whoparticipated Percent NumberPercent whoparticipated Percent NumberPercent whoparticipatedTotal persons ..................................... 45,046 19 100 25,370 11 100 50,217 21 100Population Density <strong>of</strong> ResidenceUrban .......................................... 28,670 16 64 16,895 9 67 31,106 17 62Rural .......................................... 16,376 28 36 8,475 14 33 19,111 33 38Population Size <strong>of</strong> ResidenceMetropolitan Statistical Area (MSA) ................. 41,168 18 91 23,126 10 91 45,739 20 911,000,000 or more .............................. 20,309 16 45 11,867 9 47 22,417 18 45250,000 to 999,999 ............................. 10,220 21 23 5,575 12 22 11,656 24 2350,000 to 249,999 .............................. 10,640 22 24 5,684 12 22 11,666 24 23Outside MSA .................................... 3,878 25 9 2,243 15 9 4,478 29 9Census Geographic DivisionNew Engl<strong>and</strong> .................................... 2,630 23 6 1,688 15 7 2,938 25 6Middle Atlantic .................................. 6,231 19 14 3,269 10 13 6,089 19 12East North Central ................................ 7,530 21 17 4,599 13 18 9,874 27 20West North Central ............................... 3,328 21 7 1,848 12 7 3,992 25 8South Atlantic ................................... 7,863 17 17 4,346 9 17 9,493 20 19East South Central ................................ 2,765 19 6 1,292 9 5 3,560 25 7West South Central ............................... 4,979 18 11 2,412 9 10 5,545 20 11Mountain ....................................... 3,346 20 7 2,057 12 8 3,049 18 6Pacific ......................................... 6,374 17 14 3,858 10 15 5,677 15 11Age16 to 17 years ................................... 399 5 1 452 6 2 453 6 118 to 24 years ................................... 1398 5 3 748 3 3 1287 5 325 to 34 years ................................... 4087 10 9 3181 8 13 4511 11 935 to 44 years ................................... 6014 15 13 3969 10 16 5802 14 1245 to 54 years ................................... 9608 21 21 6212 13 24 10642 23 2155 to 64 years ................................... 10757 28 24 6174 16 24 12222 32 2465 years <strong>and</strong> older ................................ 12783 34 28 4635 12 18 15300 40 3065 to 74 years ................................. 8734 39 19 3714 16 15 9946 44 2075 <strong>and</strong> older ................................... 4048 26 9 921 6 4 5354 35 11SexMale, total ...................................... 19,525 17 43 11,995 10 47 21,404 19 4316 to 17 years ................................. *250 *6 *1 *273 *7 *1 *204 *5 *(Z)18 to 24 years ................................. 658 5 1 458 4 2 361 3 125 to 34 years ................................. 1,752 9 4 1,282 6 5 2,002 10 435 to 44 years ................................. 2,852 14 6 1,851 9 7 2,513 13 545 to 54 years ................................. 3,947 18 9 3,086 14 12 4,594 20 955 to 64 years ................................. 4,959 27 11 2,718 15 11 5,374 29 1165 years <strong>and</strong> older .............................. 5,106 30 11 2,328 14 9 6,356 37 1365 to 74 years ............................... 3,697 34 8 1,826 17 7 4,178 39 875 <strong>and</strong> older ................................. 1,409 22 3 502 8 2 2,178 35 4Female, total .................................... 25,521 20 57 13,374 11 53 28,813 23 5716 to 17 years ................................. *149 *4 *(Z) *179 *5 *1 *249 *7 *(Z)18 to 24 years ................................. 739 5 2 290 2 1 926 7 225 to 34 years ................................. 2,336 11 5 1,898 9 7 2,508 12 535 to 44 years ................................. 3,162 15 7 2,118 10 8 3,289 16 745 to 54 years ................................. 5,661 24 13 3,126 13 12 6,049 25 1255 to 64 years ................................. 5,798 29 13 3,456 17 14 6,848 34 1465 years <strong>and</strong> older .............................. 7,677 37 17 2,307 11 9 8,944 43 1865 to 74 years ............................... 5,038 43 11 1,888 16 7 5,767 49 1175 <strong>and</strong> older ................................. 2,639 29 6 419 5 2 3,176 35 6EthnicityHispanic ....................................... 2,223 7 5 1,276 4 5 2,640 8 5Non-Hispanic ................................... 42,823 21 95 24,094 12 95 47,576 23 95RaceWhite .......................................... 41,269 23 92 23,396 13 92 46,225 25 92African American ................................ 1,750 7 4 716 3 3 1,518 6 3Asian American .................................. 323 3 1 368 3 1 620 5 1<strong>All</strong> others ....................................... 1,704 8 4 890 4 4 1,854 9 4Annual Household IncomeLess than $20,000 ................................ 4,414 14 10 1,656 5 7 4,603 15 9$20,000 to $24,999 ............................... 2,113 17 5 1,032 8 4 2,835 22 6$25,000 to $29,999 ............................... 1,370 13 3 598 6 2 1,805 17 4$30,000 to $34,999 ............................... 2,791 24 6 893 8 4 3,162 27 6$35,000 to $39,999 ............................... 2,102 18 5 1,157 10 5 2,293 20 5$40,000 to $49,999 ............................... 3,562 21 8 1,916 11 8 3,596 21 7$50,000 to $74,999 ............................... 7,544 22 17 5,063 15 20 8,345 25 17$75,000 to $99,999 ............................... 5,788 23 13 3,674 15 14 6,362 25 13$100,000 to $149,999 ............................. 5,488 23 12 3,728 16 15 5,620 24 11$150,000 or more ................................ 3,683 21 8 2,792 16 11 4,223 25 8Not reported .................................... 6,192 14 14 2,862 6 11 7,374 16 15Education11 years or less .................................. 3,414 11 8 1,228 4 5 4,011 13 812 years ........................................ 12,933 16 29 6,225 8 25 16,061 20 321 to 3 years <strong>of</strong> college ............................. 10,026 18 22 6,002 11 24 10,963 20 224 years <strong>of</strong> college ................................ 10,211 24 23 6,345 15 25 11,479 27 235 years or more <strong>of</strong> college .......................... 8,462 30 19 5,569 20 22 7,701 27 15* Estimate based on a sample size <strong>of</strong> 10–29. (Z) Less than 0.5 percent.Note: Detail does not add to total because <strong>of</strong> multiple responses <strong>and</strong> nonresponse. Percent who participated columns show the percent <strong>of</strong> each row’s populationwho participated in the activity named by the column. Percent columns show the percent <strong>of</strong> each column’s participants who are described by the row heading.Percent92 2011 <strong>National</strong> <strong>Survey</strong> <strong>of</strong> <strong>Fishing</strong>, <strong>Hunting</strong>, <strong>and</strong> <strong>Wildlife</strong>-Associated Recreation U.S. Fish <strong>and</strong> <strong>Wildlife</strong> Service <strong>and</strong> U.S. Census Bureau
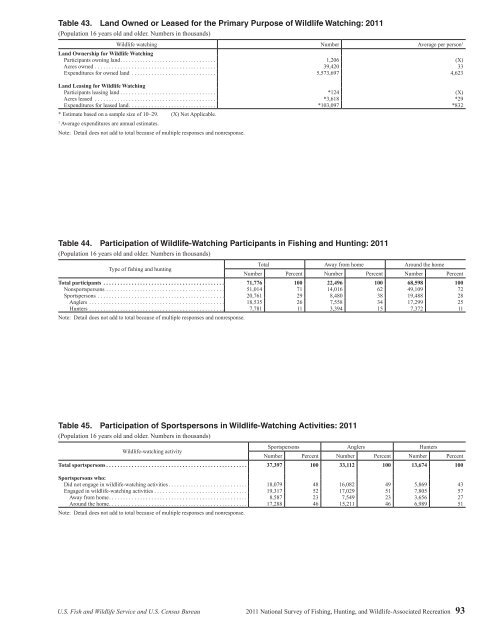
Table 43. L<strong>and</strong> Owned or Leased for the Primary Purpose <strong>of</strong> <strong>Wildlife</strong> Watching: 2011(Population 16 years old <strong>and</strong> older. Numbers in thous<strong>and</strong>s)<strong>Wildlife</strong> watching Number Average per person 1L<strong>and</strong> Ownership for <strong>Wildlife</strong> WatchingParticipants owning l<strong>and</strong> .................................. 1,206 (X)Acres owned ........................................... 39,420 33Expenditures for owned l<strong>and</strong> .............................. 5,573,697 4,623L<strong>and</strong> Leasing for <strong>Wildlife</strong> WatchingParticipants leasing l<strong>and</strong> .................................. *124 (X)Acres leased ........................................... *3,618 *29Expenditures for leased l<strong>and</strong> ............................... *103,097 *832* Estimate based on a sample size <strong>of</strong> 10–29. (X) Not Applicable.1Average expenditures are annual estimates.Note: Detail does not add to total because <strong>of</strong> multiple responses <strong>and</strong> nonresponse.Table 44. Participation <strong>of</strong> <strong>Wildlife</strong>-Watching Participants in <strong>Fishing</strong> <strong>and</strong> <strong>Hunting</strong>: 2011(Population 16 years old <strong>and</strong> older. Numbers in thous<strong>and</strong>s)Type <strong>of</strong> fishing <strong>and</strong> huntingTotal Away from home Around the homeNumber Percent Number Percent Number PercentTotal participants ........................................... 71,776 100 22,496 100 68,598 100Nonsportspersons .......................................... 51,014 71 14,016 62 49,109 72Sportspersons ............................................. 20,761 29 8,480 38 19,488 28Anglers ................................................ 18,535 26 7,558 34 17,299 25Hunters ................................................ 7,781 11 3,394 15 7,372 11Note: Detail does not add to total because <strong>of</strong> multiple responses <strong>and</strong> nonresponse.Table 45. Participation <strong>of</strong> Sportspersons in <strong>Wildlife</strong>-Watching Activities: 2011(Population 16 years old <strong>and</strong> older. Numbers in thous<strong>and</strong>s)<strong>Wildlife</strong>-watching activitySportspersons Anglers HuntersNumber Percent Number Percent Number PercentTotal sportspersons .................................................. 37,397 100 33,112 100 13,674 100Sportspersons who:Did not engage in wildlife-watching activities ............................ 18,079 48 16,082 49 5,869 43Engaged in wildlife-watching activities ................................. 19,317 52 17,029 51 7,805 57Away from home ................................................. 8,587 23 7,549 23 3,656 27Around the home ................................................. 17,288 46 15,211 46 6,989 51Note: Detail does not add to total because <strong>of</strong> multiple responses <strong>and</strong> nonresponse.U.S. Fish <strong>and</strong> <strong>Wildlife</strong> Service <strong>and</strong> U.S. Census Bureau 2011 <strong>National</strong> <strong>Survey</strong> <strong>of</strong> <strong>Fishing</strong>, <strong>Hunting</strong>, <strong>and</strong> <strong>Wildlife</strong>-Associated Recreation 93
- Page 1:
U.S. Fish & Wildlife Service2011Nat
- Page 4 and 5:
Economics and StatisticsAdministrat
- Page 6 and 7:
List of TablesFishing and Hunting1.
- Page 8 and 9:
ForewordWhen I was growing up, it w
- Page 11 and 12:
Highlights
- Page 13 and 14:
watching (observing, photographing,
- Page 15 and 16:
Expenditures for Wildlife-Related R
- Page 17 and 18:
Fishing
- Page 19 and 20:
Fishing ExpendituresAnglers spent $
- Page 21 and 22:
Freshwater Fishing ExpendituresAngl
- Page 23 and 24:
pike, pickerel, and muskie, as well
- Page 25 and 26:
Sex and Age of AnglersAlthough more
- Page 27 and 28:
The majority of anglers had househo
- Page 29:
2001-2011 Fishing Participants, Day
- Page 32 and 33:
Hunting HighlightsIn 2011, 13.7 mil
- Page 34 and 35:
Big Game HuntingIn 2011, a majority
- Page 36 and 37:
Days per hunterTrips per hunterTrip
- Page 38 and 39:
Hunting on Public and PrivateLandsm
- Page 40 and 41:
Large MSA25%Medium MSA17%Percent of
- Page 42 and 43:
Hispanics, who represent a growingp
- Page 45 and 46:
Wildlife WatchingU.S. Fish and Wild
- Page 47 and 48:
Wildlife-Watching ExpendituresThirt
- Page 49 and 50:
Wildlife Fed, Observed, orPhotograp
- Page 51 and 52: Metropolitan and NonmetropolitanAro
- Page 53 and 54: Education, Race, and Ethnicity ofAr
- Page 55 and 56: Away-From-Home Participantsby Type
- Page 57 and 58: Away-From-Home WildlifeWatchers by
- Page 59 and 60: Metropolitan and NonmetropolitanAwa
- Page 61 and 62: 2001-2011 Comparison of Wildlife-Wa
- Page 63: 2006-2011 Wildlife-Watching Partici
- Page 66 and 67: Guide to Statistical TablesPurpose
- Page 68 and 69: Table 3. Freshwater Anglers and Day
- Page 70 and 71: Table 7. Hunters and Days of Huntin
- Page 72 and 73: Table 8. Selected Characteristics o
- Page 74 and 75: Table 9. Selected Characteristics o
- Page 76 and 77: Table 10. Selected Characteristics
- Page 78 and 79: Table 12. Expenditures for Fishing:
- Page 80 and 81: Table 14. Trip and Equipment Expend
- Page 82 and 83: Table 16. Trip and Equipment Expend
- Page 84 and 85: Table 18. Trip and Equipment Expend
- Page 86 and 87: Table 20. Trip and Equipment Expend
- Page 88 and 89: Table 22. Special Equipment Expendi
- Page 90 and 91: Table 25. Freshwater Anglers and Da
- Page 92 and 93: Table 29. Hunters and Days of Hunti
- Page 94 and 95: Table 33. Hunters Preparing for Hun
- Page 96 and 97: Table 37. Participation in Wildlife
- Page 98 and 99: Table 40. Expenditures for Wildlife
- Page 100 and 101: Table 41. Selected Characteristics
- Page 104 and 105: Table 46. Total Wildlife-Related Pa
- Page 106 and 107: Appendix A.DefinitionsAnnual househ
- Page 108 and 109: State governments (such as State pa
- Page 110 and 111: Appendix B.2010 Participation of 6-
- Page 112 and 113: Table B-4. Most Recent Year of Fish
- Page 114 and 115: Table B-7. Selected Characteristics
- Page 116 and 117: Table B-9. Participation by 6-to-15
- Page 118 and 119: Appendix C.Significant Methodologic
- Page 120 and 121: Table C-1. Major Characteristics of
- Page 122 and 123: Table C-2. Anglers and Hunters by C
- Page 124 and 125: household income in the 2001Survey.
- Page 126 and 127: Table C-4. Comparison of Major Find
- Page 128 and 129: Table C-5. Anglers and Hunters by C
- Page 130 and 131: Appendix D.Sample Design and Statis
- Page 132 and 133: lation 6 to 15 years of age were de
- Page 134 and 135: compute in advance the standard err
- Page 136 and 137: Illustration of the Computation of
- Page 138 and 139: Table D-2. Approximate Standard Err
- Page 140 and 141: Table D-4. Approximate Standard Err
- Page 143: U.S. Department of the InteriorU.S.