Table 25. Freshwater Anglers <strong>and</strong> Days <strong>of</strong> <strong>Fishing</strong> by Type <strong>of</strong> Water: 2011(Population 16 years old <strong>and</strong> older. Numbers in thous<strong>and</strong>s. Excludes Great Lakes fishing)Type <strong>of</strong> waterAnglersDays <strong>of</strong> fishingNumber Percent Number PercentTotal, all types <strong>of</strong> water ...................................... 27,060 100 443,223 100Lakes, reservoirs, <strong>and</strong> ponds ................................. 22,791 84 335,732 76Rivers or streams .......................................... 11,888 44 148,218 33Note: Detail does not add to total because <strong>of</strong> multiple responses <strong>and</strong> nonresponse.Table 26. Great Lakes Anglers <strong>and</strong> Days <strong>of</strong> <strong>Fishing</strong> by Great Lake: 2011(Population 16 years old <strong>and</strong> older. Numbers in thous<strong>and</strong>s)Great LakeAnglersDays <strong>of</strong> fishingNumber Percent Number PercentTotal, all Great Lakes ..................................... 1,665 100 19,661 100Lake Ontario, including the Niagara River .................... *143 *9 *2,214 *11Lake Erie, including the Detroit River ....................... 639 38 8,451 43Lake Huron, including St. Mary’s River System ............... *262 *16 *4,410 *22Lake Michigan ......................................... 413 25 2,585 13Lake Superior .......................................... *147 *9 *1,527 *8Lake St. Clair, including the St. Clair River ................... ... ... ... ...St Lawrence River ....................................... ... ... ... ...Tributaries to the Great Lakes .............................. *159 *10 *1,254 *6* Estimate based on a sample size <strong>of</strong> 10–29. … Sample size too small (less than 10) to report data reliably.Note: Detail does not add to total because <strong>of</strong> multiple responses <strong>and</strong> nonresponse.Table 27. Hunters <strong>and</strong> Days <strong>of</strong> <strong>Hunting</strong> on Public <strong>and</strong> Private L<strong>and</strong> by Type <strong>of</strong> <strong>Hunting</strong>: 2011(Population 16 years old <strong>and</strong> older. Numbers in thous<strong>and</strong>s)Hunters <strong>and</strong> days <strong>of</strong> huntingHUNTERSTotal, all hunting Big game Small game Migratory birds Other animalsNumber Percent Number Percent Number Percent Number Percent Number PercentTotal, all l<strong>and</strong> .................. 13,674 100 11,570 100 4,506 100 2,583 100 2,168 100Public l<strong>and</strong>, total ............. 4,918 36 3,767 33 1,410 31 923 36 523 24Public l<strong>and</strong> only ............ 1,733 13 1,578 14 606 13 526 20 250 12Public <strong>and</strong> private l<strong>and</strong> ....... 3,185 23 2,189 19 805 18 397 15 273 13Private l<strong>and</strong>, total ............ 11,537 84 9,696 84 3,756 83 1,999 77 1,886 87Private l<strong>and</strong> only ............ 8,352 61 7,507 65 2,951 65 1,602 62 1,614 74Private <strong>and</strong> public l<strong>and</strong> ....... 3,185 23 2,189 19 805 18 397 15 273 13DAYS OF HUNTINGTotal, all l<strong>and</strong> .................. 281,884 100 212,116 100 50,884 100 23,263 100 34,434 100Public l<strong>and</strong> 1 .................. 61,486 22 39,149 18 13,915 27 8,467 36 5,452 16Private l<strong>and</strong> 2 ................. 218,839 78 167,271 79 36,951 73 13,292 57 27,161 791Days <strong>of</strong> hunting on public l<strong>and</strong> include both days spent solely on public l<strong>and</strong> <strong>and</strong> those spent on public <strong>and</strong> private l<strong>and</strong>.2Days <strong>of</strong> hunting on private l<strong>and</strong> include both days spent solely on private l<strong>and</strong> <strong>and</strong> those spent on private <strong>and</strong> public l<strong>and</strong>.Note: Detail does not add to total because <strong>of</strong> multiple responses <strong>and</strong> nonresponse.80 2011 <strong>National</strong> <strong>Survey</strong> <strong>of</strong> <strong>Fishing</strong>, <strong>Hunting</strong>, <strong>and</strong> <strong>Wildlife</strong>-Associated Recreation U.S. Fish <strong>and</strong> <strong>Wildlife</strong> Service <strong>and</strong> U.S. Census Bureau
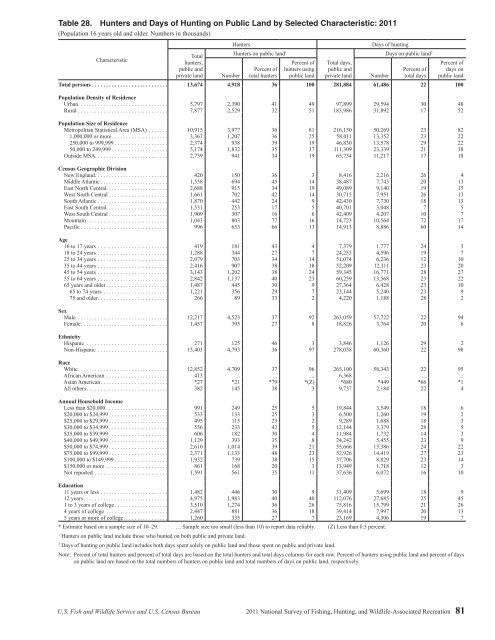
Table 28. Hunters <strong>and</strong> Days <strong>of</strong> <strong>Hunting</strong> on Public L<strong>and</strong> by Selected Characteristic: 2011(Population 16 years old <strong>and</strong> older. Numbers in thous<strong>and</strong>s)CharacteristicTotalhunters,public <strong>and</strong>private l<strong>and</strong>NumberHuntersHunters on public l<strong>and</strong> 1Percent <strong>of</strong>total huntersPercent <strong>of</strong>hunters usingpublic l<strong>and</strong>Total days,public <strong>and</strong>private l<strong>and</strong>Days <strong>of</strong> huntingNumberDays on public l<strong>and</strong> 2Percent <strong>of</strong>total daysPercent <strong>of</strong>days onpublic l<strong>and</strong>Total persons ........................... 13,674 4,918 36 100 281,884 61,486 22 100Population Density <strong>of</strong> ResidenceUrban ................................ 5,797 2,390 41 49 97,899 29,594 30 48Rural ................................ 7,877 2,529 32 51 183,986 31,892 17 52Population Size <strong>of</strong> ResidenceMetropolitan Statistical Area (MSA) ....... 10,915 3,977 36 81 216,150 50,269 23 821,000,000 or more .................... 3,367 1,207 36 25 58,011 13,352 23 22250,000 to 999,999 ................... 2,374 938 39 19 46,830 13,578 29 2250,000 to 249,999 .................... 5,174 1,832 35 37 111,309 23,339 21 38Outside MSA .......................... 2,759 941 34 19 65,734 11,217 17 18Census Geographic DivisionNew Engl<strong>and</strong> .......................... 420 150 36 3 8,416 2,216 26 4Middle Atlantic ........................ 1,558 694 45 14 38,487 7,743 20 13East North Central ...................... 2,688 915 34 19 49,089 9,140 19 15West North Central ..................... 1,661 702 42 14 30,715 7,951 26 13South Atlantic ......................... 1,870 442 24 9 42,430 7,730 18 13East South Central ...................... 1,531 253 17 5 40,701 3,048 7 5West South Central ..................... 1,909 307 16 6 42,409 4,207 10 7Mountain ............................. 1,043 803 77 16 14,723 10,564 72 17Pacific ............................... 996 653 66 13 14,913 8,886 60 14Age16 to 17 years ......................... 419 181 43 4 7,379 1,777 24 318 to 24 years ......................... 1,288 344 27 7 24,253 4,596 19 725 to 34 years ......................... 2,079 703 34 14 51,074 6,236 12 1035 to 44 years ......................... 2,416 907 38 18 52,209 12,111 23 2045 to 54 years ......................... 3,143 1,202 38 24 59,345 16,771 28 2755 to 64 years ......................... 2,842 1,137 40 23 60,259 13,568 23 2265 years <strong>and</strong> older ...................... 1,487 445 30 9 27,364 6,428 23 1065 to 74 years ....................... 1,221 356 29 7 23,144 5,240 23 975 <strong>and</strong> older ......................... 266 89 33 2 4,220 1,188 28 2SexMale ................................ 12,217 4,523 37 92 263,059 57,722 22 94Female ............................... 1,457 395 27 8 18,826 3,764 20 6EthnicityHispanic ............................. 271 125 46 3 3,846 1,126 29 2Non-Hispanic ......................... 13,403 4,793 36 97 278,038 60,360 22 98RaceWhite ................................ 12,852 4,709 37 96 265,100 58,343 22 95African American ...................... 413 ... ... ... 6,368 ... ... ...Asian American ........................ *27 *21 *79 *(Z) *680 *449 *66 *1<strong>All</strong> others ............................. 382 145 38 3 9,737 2,184 22 4Annual Household IncomeLess than $20,000 ...................... 991 249 25 5 19,844 3,549 18 6$20,000 to $24,999 ..................... 533 133 25 3 6,500 1,260 19 2$25,000 to $29,999 ..................... 495 115 23 2 9,289 1,688 18 3$30,000 to $34,999 ..................... 556 233 42 5 12,144 3,379 28 5$35,000 to $39,999 ..................... 606 182 30 4 11,984 1,732 14 3$40,000 to $49,999 ..................... 1,129 393 35 8 24,242 5,455 23 9$50,000 to $74,999 ..................... 2,610 1,014 39 21 55,666 13,386 24 22$75,000 to $99,999 ..................... 2,371 1,133 48 23 52,926 14,419 27 23$100,000 to $149,999 ................... 1,932 739 38 15 37,706 8,829 23 14$150,000 or more ...................... 861 168 20 3 13,949 1,718 12 3Not reported .......................... 1,591 561 35 11 37,636 6,072 16 10Education11 years or less ........................ 1,482 446 30 9 31,409 5,699 18 912 years .............................. 4,975 1,983 40 40 112,076 27,685 25 451 to 3 years <strong>of</strong> college ................... 3,510 1,274 36 26 75,816 15,799 21 264 years <strong>of</strong> college ...................... 2,447 881 36 18 39,414 7,997 20 135 years or more <strong>of</strong> college ................ 1,260 335 27 7 23,169 4,306 19 7* Estimate based on a sample size <strong>of</strong> 10–29. … Sample size too small (less than 10) to report data reliably. (Z) Less than 0.5 percent.1Hunters on public l<strong>and</strong> include those who hunted on both public <strong>and</strong> private l<strong>and</strong>.2Days <strong>of</strong> hunting on public l<strong>and</strong> includes both days spent solely on public l<strong>and</strong> <strong>and</strong> those spent on public <strong>and</strong> private l<strong>and</strong>.Note: Percent <strong>of</strong> total hunters <strong>and</strong> percent <strong>of</strong> total days are based on the total hunters <strong>and</strong> total days columns for each row. Percent <strong>of</strong> hunters using public l<strong>and</strong> <strong>and</strong> percent <strong>of</strong> dayson public l<strong>and</strong> are based on the total numbers <strong>of</strong> hunters on public l<strong>and</strong> <strong>and</strong> total numbers <strong>of</strong> days on public l<strong>and</strong>, respectively.U.S. Fish <strong>and</strong> <strong>Wildlife</strong> Service <strong>and</strong> U.S. Census Bureau 2011 <strong>National</strong> <strong>Survey</strong> <strong>of</strong> <strong>Fishing</strong>, <strong>Hunting</strong>, <strong>and</strong> <strong>Wildlife</strong>-Associated Recreation 81
- Page 1:
U.S. Fish & Wildlife Service2011Nat
- Page 4 and 5:
Economics and StatisticsAdministrat
- Page 6 and 7:
List of TablesFishing and Hunting1.
- Page 8 and 9:
ForewordWhen I was growing up, it w
- Page 11 and 12:
Highlights
- Page 13 and 14:
watching (observing, photographing,
- Page 15 and 16:
Expenditures for Wildlife-Related R
- Page 17 and 18:
Fishing
- Page 19 and 20:
Fishing ExpendituresAnglers spent $
- Page 21 and 22:
Freshwater Fishing ExpendituresAngl
- Page 23 and 24:
pike, pickerel, and muskie, as well
- Page 25 and 26:
Sex and Age of AnglersAlthough more
- Page 27 and 28:
The majority of anglers had househo
- Page 29:
2001-2011 Fishing Participants, Day
- Page 32 and 33:
Hunting HighlightsIn 2011, 13.7 mil
- Page 34 and 35:
Big Game HuntingIn 2011, a majority
- Page 36 and 37:
Days per hunterTrips per hunterTrip
- Page 38 and 39:
Hunting on Public and PrivateLandsm
- Page 40 and 41: Large MSA25%Medium MSA17%Percent of
- Page 42 and 43: Hispanics, who represent a growingp
- Page 45 and 46: Wildlife WatchingU.S. Fish and Wild
- Page 47 and 48: Wildlife-Watching ExpendituresThirt
- Page 49 and 50: Wildlife Fed, Observed, orPhotograp
- Page 51 and 52: Metropolitan and NonmetropolitanAro
- Page 53 and 54: Education, Race, and Ethnicity ofAr
- Page 55 and 56: Away-From-Home Participantsby Type
- Page 57 and 58: Away-From-Home WildlifeWatchers by
- Page 59 and 60: Metropolitan and NonmetropolitanAwa
- Page 61 and 62: 2001-2011 Comparison of Wildlife-Wa
- Page 63: 2006-2011 Wildlife-Watching Partici
- Page 66 and 67: Guide to Statistical TablesPurpose
- Page 68 and 69: Table 3. Freshwater Anglers and Day
- Page 70 and 71: Table 7. Hunters and Days of Huntin
- Page 72 and 73: Table 8. Selected Characteristics o
- Page 74 and 75: Table 9. Selected Characteristics o
- Page 76 and 77: Table 10. Selected Characteristics
- Page 78 and 79: Table 12. Expenditures for Fishing:
- Page 80 and 81: Table 14. Trip and Equipment Expend
- Page 82 and 83: Table 16. Trip and Equipment Expend
- Page 84 and 85: Table 18. Trip and Equipment Expend
- Page 86 and 87: Table 20. Trip and Equipment Expend
- Page 88 and 89: Table 22. Special Equipment Expendi
- Page 92 and 93: Table 29. Hunters and Days of Hunti
- Page 94 and 95: Table 33. Hunters Preparing for Hun
- Page 96 and 97: Table 37. Participation in Wildlife
- Page 98 and 99: Table 40. Expenditures for Wildlife
- Page 100 and 101: Table 41. Selected Characteristics
- Page 102 and 103: Table 42. Selected Characteristics
- Page 104 and 105: Table 46. Total Wildlife-Related Pa
- Page 106 and 107: Appendix A.DefinitionsAnnual househ
- Page 108 and 109: State governments (such as State pa
- Page 110 and 111: Appendix B.2010 Participation of 6-
- Page 112 and 113: Table B-4. Most Recent Year of Fish
- Page 114 and 115: Table B-7. Selected Characteristics
- Page 116 and 117: Table B-9. Participation by 6-to-15
- Page 118 and 119: Appendix C.Significant Methodologic
- Page 120 and 121: Table C-1. Major Characteristics of
- Page 122 and 123: Table C-2. Anglers and Hunters by C
- Page 124 and 125: household income in the 2001Survey.
- Page 126 and 127: Table C-4. Comparison of Major Find
- Page 128 and 129: Table C-5. Anglers and Hunters by C
- Page 130 and 131: Appendix D.Sample Design and Statis
- Page 132 and 133: lation 6 to 15 years of age were de
- Page 134 and 135: compute in advance the standard err
- Page 136 and 137: Illustration of the Computation of
- Page 138 and 139: Table D-2. Approximate Standard Err
- Page 140 and 141:
Table D-4. Approximate Standard Err
- Page 143:
U.S. Department of the InteriorU.S.