Table 18. Trip <strong>and</strong> Equipment Expenditures for Big Game <strong>Hunting</strong>: 2011(Population 16 years old <strong>and</strong> older)Expenditure itemExpendituresAmount(thous<strong>and</strong>s<strong>of</strong> dollars)Averageper hunter(dollars) 1Number(thous<strong>and</strong>s)SpendersPercent<strong>of</strong> huntersAverageper spender(dollars) 1Total, all items .................................................... 16,853,654 1,457 10,832 94 1,556TRIP-RELATED EXPENDITURESTotal trip-related .................................................. 7,250,037 627 10,035 87 722Food <strong>and</strong> lodging, total ............................................. 2,648,161 229 8,599 74 308Food .......................................................... 2,249,911 194 8,564 74 263Lodging ........................................................ 398,250 34 1,205 10 330Transportation, total ............................................... 3,368,532 291 9,146 79 368Public ......................................................... 187,802 16 459 4 409Private ......................................................... 3,180,730 275 9,072 78 351Other trip costs, total .............................................. 1,233,345 107 3,579 31 345Guide fees, pack trip or package fees ................................. 321,270 28 635 5 506Public l<strong>and</strong> use fees ............................................... 29,685 3 521 5 57Private l<strong>and</strong> use fees .............................................. 550,410 48 878 8 627Equipment rental ................................................. 55,106 5 362 3 152Boating costs 2 ................................................... 122,485 11 187 2 655Heating <strong>and</strong> cooking fuel .......................................... 154,388 13 2,426 21 64EQUIPMENT EXPENDITURES<strong>Hunting</strong> equipment, total ........................................... 3,943,190 341 7,451 64 529Firearms ....................................................... 1,357,095 117 1,610 14 843Rifles ........................................................ 960,161 83 1,155 10 831Shotguns ..................................................... 155,790 13 349 3 447Muzzleloaders, primitive firearms ................................. 115,257 10 336 3 343Pistols, h<strong>and</strong>guns. . . . . . . . . . . . . . . . . . . . . . . . . . . . . . . . . . . . . . . . . . . . . . . 125,887 11 149 1 845Bows, arrows, archery equipment .................................... 880,239 76 2,628 23 335Telescopic sights ................................................. 429,382 37 1,356 12 317Decoys <strong>and</strong> game calls ............................................ 90,590 8 1,474 13 61Ammunition .................................................... 628,379 54 5,193 45 121H<strong>and</strong> loading equipment ........................................... 80,039 7 809 7 99<strong>Hunting</strong> dogs <strong>and</strong> associated costs ................................... *186,857 *16 *194 *2 *963Other .......................................................... 290,609 25 2,033 18 143Auxiliary equipment, total .......................................... 1,549,539 134 4,176 36 371Camping equipment .............................................. 144,504 12 425 4 340Binoculars, field glasses, telescopes, etc. .............................. 248,233 21 913 8 272Special hunting clothing, rubber boots, waders, <strong>and</strong>foul weather gear ............................................... 434,845 38 2,245 19 194Processing <strong>and</strong> taxidermy costs ..................................... 614,547 53 1,862 16 330Other .......................................................... 107,410 9 492 4 218Special equipment 3 ................................................ 4,110,887 355 534 5 7,697* Estimate based on a sample size <strong>of</strong> 10–29.1Average expenditures are annual estimates.2Boating costs include launching, mooring, storage, maintenance, insurance, pumpout fees, <strong>and</strong> fuel.3Special equipment includes boats, campers, cabins, trail bikes, dune buggies, 4 x 4 vehicles, ATVs, 4-wheelers, snowmobiles, pickups, vans, travel <strong>and</strong> tent trailers, motor homes,house trailers, recreational vehicles (RVs) <strong>and</strong> other special equipment.Note: Detail does not add to total because <strong>of</strong> multiple responses.74 2011 <strong>National</strong> <strong>Survey</strong> <strong>of</strong> <strong>Fishing</strong>, <strong>Hunting</strong>, <strong>and</strong> <strong>Wildlife</strong>-Associated Recreation U.S. Fish <strong>and</strong> <strong>Wildlife</strong> Service <strong>and</strong> U.S. Census Bureau
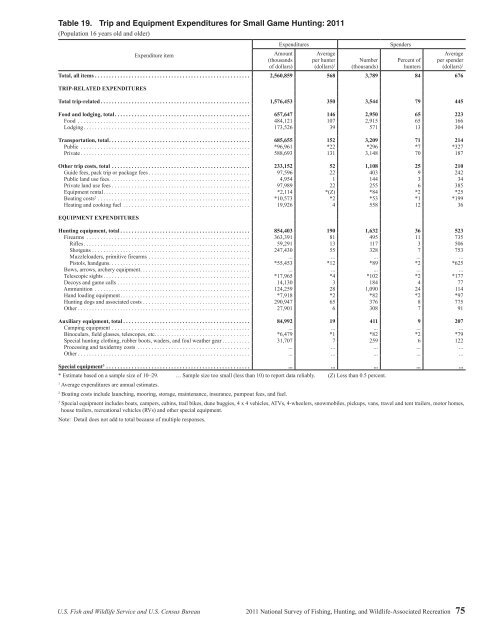
Table 19. Trip <strong>and</strong> Equipment Expenditures for Small Game <strong>Hunting</strong>: 2011(Population 16 years old <strong>and</strong> older)Expenditure itemExpendituresAmount(thous<strong>and</strong>s<strong>of</strong> dollars)Averageper hunter(dollars) 1Number(thous<strong>and</strong>s)SpendersPercent <strong>of</strong>huntersAverageper spender(dollars) 1Total, all items ....................................................... 2,560,859 568 3,789 84 676TRIP-RELATED EXPENDITURESTotal trip-related ..................................................... 1,576,453 350 3,544 79 445Food <strong>and</strong> lodging, total ................................................ 657,647 146 2,950 65 223Food ............................................................. 484,121 107 2,915 65 166Lodging ........................................................... 173,526 39 571 13 304Transportation, total .................................................. 685,655 152 3,209 71 214Public ............................................................ *96,961 *22 *296 *7 *327Private ............................................................ 588,693 131 3,148 70 187Other trip costs, total ................................................. 233,152 52 1,108 25 210Guide fees, pack trip or package fees .................................... 97,596 22 403 9 242Public l<strong>and</strong> use fees .................................................. 4,954 1 144 3 34Private l<strong>and</strong> use fees ................................................. 97,989 22 255 6 385Equipment rental .................................................... *2,114 *(Z) *84 *2 *25Boating costs 2 ...................................................... *10,573 *2 *53 *1 *199Heating <strong>and</strong> cooking fuel ............................................. 19,926 4 558 12 36EQUIPMENT EXPENDITURES<strong>Hunting</strong> equipment, total .............................................. 854,403 190 1,632 36 523Firearms .......................................................... 363,391 81 495 11 735Rifles ........................................................... 59,291 13 117 3 506Shotguns ........................................................ 247,430 55 328 7 753Muzzleloaders, primitive firearms .................................... ... ... ... ... ...Pistols, h<strong>and</strong>guns. . . . . . . . . . . . . . . . . . . . . . . . . . . . . . . . . . . . . . . . . . . . . . . . . . *55,453 *12 *89 *2 *625Bows, arrows, archery equipment ....................................... ... ... ... ... ...Telescopic sights .................................................... *17,965 *4 *102 *2 *177Decoys <strong>and</strong> game calls ............................................... 14,130 3 184 4 77Ammunition ....................................................... 124,259 28 1,090 24 114H<strong>and</strong> loading equipment .............................................. *7,918 *2 *82 *2 *97<strong>Hunting</strong> dogs <strong>and</strong> associated costs ...................................... 290,947 65 376 8 775Other ............................................................. 27,901 6 308 7 91Auxiliary equipment, total ............................................. 84,992 19 411 9 207Camping equipment ................................................. ... ... ... ... ...Binoculars, field glasses, telescopes, etc. ................................. *6,479 *1 *82 *2 *79Special hunting clothing, rubber boots, waders, <strong>and</strong> foul weather gear .......... 31,707 7 259 6 122Processing <strong>and</strong> taxidermy costs ........................................ ... ... ... ... ...Other ............................................................. ... ... ... ... ...Special equipment 3 ................................................... ... ... ... ... ...* Estimate based on a sample size <strong>of</strong> 10–29. … Sample size too small (less than 10) to report data reliably. (Z) Less than 0.5 percent.1Average expenditures are annual estimates.2Boating costs include launching, mooring, storage, maintenance, insurance, pumpout fees, <strong>and</strong> fuel.3Special equipment includes boats, campers, cabins, trail bikes, dune buggies, 4 x 4 vehicles, ATVs, 4-wheelers, snowmobiles, pickups, vans, travel <strong>and</strong> tent trailers, motor homes,house trailers, recreational vehicles (RVs) <strong>and</strong> other special equipment.Note: Detail does not add to total because <strong>of</strong> multiple responses.U.S. Fish <strong>and</strong> <strong>Wildlife</strong> Service <strong>and</strong> U.S. Census Bureau 2011 <strong>National</strong> <strong>Survey</strong> <strong>of</strong> <strong>Fishing</strong>, <strong>Hunting</strong>, <strong>and</strong> <strong>Wildlife</strong>-Associated Recreation 75
- Page 1:
U.S. Fish & Wildlife Service2011Nat
- Page 4 and 5:
Economics and StatisticsAdministrat
- Page 6 and 7:
List of TablesFishing and Hunting1.
- Page 8 and 9:
ForewordWhen I was growing up, it w
- Page 11 and 12:
Highlights
- Page 13 and 14:
watching (observing, photographing,
- Page 15 and 16:
Expenditures for Wildlife-Related R
- Page 17 and 18:
Fishing
- Page 19 and 20:
Fishing ExpendituresAnglers spent $
- Page 21 and 22:
Freshwater Fishing ExpendituresAngl
- Page 23 and 24:
pike, pickerel, and muskie, as well
- Page 25 and 26:
Sex and Age of AnglersAlthough more
- Page 27 and 28:
The majority of anglers had househo
- Page 29:
2001-2011 Fishing Participants, Day
- Page 32 and 33:
Hunting HighlightsIn 2011, 13.7 mil
- Page 34 and 35: Big Game HuntingIn 2011, a majority
- Page 36 and 37: Days per hunterTrips per hunterTrip
- Page 38 and 39: Hunting on Public and PrivateLandsm
- Page 40 and 41: Large MSA25%Medium MSA17%Percent of
- Page 42 and 43: Hispanics, who represent a growingp
- Page 45 and 46: Wildlife WatchingU.S. Fish and Wild
- Page 47 and 48: Wildlife-Watching ExpendituresThirt
- Page 49 and 50: Wildlife Fed, Observed, orPhotograp
- Page 51 and 52: Metropolitan and NonmetropolitanAro
- Page 53 and 54: Education, Race, and Ethnicity ofAr
- Page 55 and 56: Away-From-Home Participantsby Type
- Page 57 and 58: Away-From-Home WildlifeWatchers by
- Page 59 and 60: Metropolitan and NonmetropolitanAwa
- Page 61 and 62: 2001-2011 Comparison of Wildlife-Wa
- Page 63: 2006-2011 Wildlife-Watching Partici
- Page 66 and 67: Guide to Statistical TablesPurpose
- Page 68 and 69: Table 3. Freshwater Anglers and Day
- Page 70 and 71: Table 7. Hunters and Days of Huntin
- Page 72 and 73: Table 8. Selected Characteristics o
- Page 74 and 75: Table 9. Selected Characteristics o
- Page 76 and 77: Table 10. Selected Characteristics
- Page 78 and 79: Table 12. Expenditures for Fishing:
- Page 80 and 81: Table 14. Trip and Equipment Expend
- Page 82 and 83: Table 16. Trip and Equipment Expend
- Page 86 and 87: Table 20. Trip and Equipment Expend
- Page 88 and 89: Table 22. Special Equipment Expendi
- Page 90 and 91: Table 25. Freshwater Anglers and Da
- Page 92 and 93: Table 29. Hunters and Days of Hunti
- Page 94 and 95: Table 33. Hunters Preparing for Hun
- Page 96 and 97: Table 37. Participation in Wildlife
- Page 98 and 99: Table 40. Expenditures for Wildlife
- Page 100 and 101: Table 41. Selected Characteristics
- Page 102 and 103: Table 42. Selected Characteristics
- Page 104 and 105: Table 46. Total Wildlife-Related Pa
- Page 106 and 107: Appendix A.DefinitionsAnnual househ
- Page 108 and 109: State governments (such as State pa
- Page 110 and 111: Appendix B.2010 Participation of 6-
- Page 112 and 113: Table B-4. Most Recent Year of Fish
- Page 114 and 115: Table B-7. Selected Characteristics
- Page 116 and 117: Table B-9. Participation by 6-to-15
- Page 118 and 119: Appendix C.Significant Methodologic
- Page 120 and 121: Table C-1. Major Characteristics of
- Page 122 and 123: Table C-2. Anglers and Hunters by C
- Page 124 and 125: household income in the 2001Survey.
- Page 126 and 127: Table C-4. Comparison of Major Find
- Page 128 and 129: Table C-5. Anglers and Hunters by C
- Page 130 and 131: Appendix D.Sample Design and Statis
- Page 132 and 133: lation 6 to 15 years of age were de
- Page 134 and 135:
compute in advance the standard err
- Page 136 and 137:
Illustration of the Computation of
- Page 138 and 139:
Table D-2. Approximate Standard Err
- Page 140 and 141:
Table D-4. Approximate Standard Err
- Page 143:
U.S. Department of the InteriorU.S.