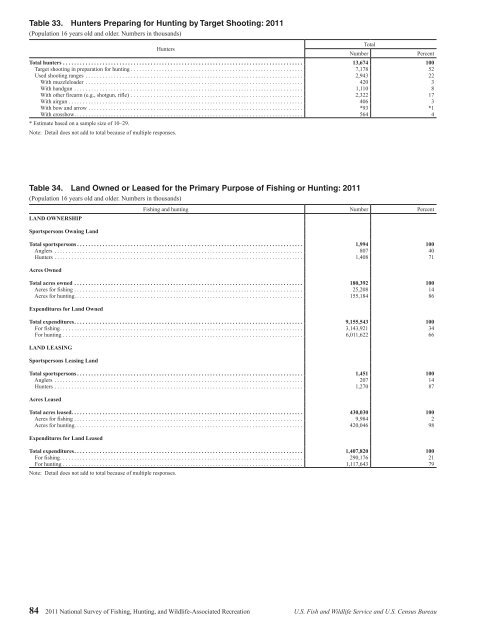
Table 33. Hunters Preparing for <strong>Hunting</strong> by Target Shooting: 2011(Population 16 years old <strong>and</strong> older. Numbers in thous<strong>and</strong>s)HuntersTotal hunters ..................................................................................... 13,674 100Target shooting in preparation for hunting ............................................................. 7,178 52Used shooting ranges ............................................................................. 2,943 22With muzzleloader ............................................................................. 420 3With h<strong>and</strong>gun ................................................................................. 1,110 8With other firearm (e.g., shotgun, rifle) ............................................................. 2,322 17With airgun ................................................................................... 406 3With bow <strong>and</strong> arrow ............................................................................ *93 *1With crossbow ................................................................................. 564 4* Estimate based on a sample size <strong>of</strong> 10–29.Note: Detail does not add to total because <strong>of</strong> multiple responses.NumberTotalPercentTable 34. L<strong>and</strong> Owned or Leased for the Primary Purpose <strong>of</strong> <strong>Fishing</strong> or <strong>Hunting</strong>: 2011(Population 16 years old <strong>and</strong> older. Numbers in thous<strong>and</strong>s)LAND OWNERSHIPSportspersons Owning L<strong>and</strong><strong>Fishing</strong> <strong>and</strong> hunting Number PercentTotal sportspersons ................................................................................ 1,994 100Anglers ........................................................................................ 807 40Hunters ........................................................................................ 1,408 71Acres OwnedTotal acres owned ................................................................................. 180,392 100Acres for fishing ................................................................................. 25,208 14Acres for hunting ................................................................................. 155,184 86Expenditures for L<strong>and</strong> OwnedTotal expenditures ................................................................................. 9,155,543 100For fishing ...................................................................................... 3,143,921 34For hunting ..................................................................................... 6,011,622 66LAND LEASINGSportspersons Leasing L<strong>and</strong>Total sportspersons ................................................................................ 1,451 100Anglers ........................................................................................ 207 14Hunters ........................................................................................ 1,270 87Acres LeasedTotal acres leased .................................................................................. 430,030 100Acres for fishing ................................................................................. 9,984 2Acres for hunting ................................................................................. 420,046 98Expenditures for L<strong>and</strong> LeasedTotal expenditures ................................................................................. 1,407,820 100For fishing ...................................................................................... 290,176 21For hunting ..................................................................................... 1,117,643 79Note: Detail does not add to total because <strong>of</strong> multiple responses.84 2011 <strong>National</strong> <strong>Survey</strong> <strong>of</strong> <strong>Fishing</strong>, <strong>Hunting</strong>, <strong>and</strong> <strong>Wildlife</strong>-Associated Recreation U.S. Fish <strong>and</strong> <strong>Wildlife</strong> Service <strong>and</strong> U.S. Census Bureau
Table 35. <strong>Wildlife</strong>-Watching Participants by Type <strong>of</strong> Activity: 2011(Population 16 years old <strong>and</strong> older. Numbers in thous<strong>and</strong>s)Activity Number PercentTotal participants .................................................................................. 71,776 100Away from home .................................................................................. 22,496 31Observe wildlife ................................................................................ 19,808 28Photograph wildlife .............................................................................. 12,354 17Feed wildlife ................................................................................... 5,399 8Around the home .................................................................................. 68,598 96Observe wildlife ................................................................................ 45,046 63Photograph wildlife .............................................................................. 25,370 35Feed wildlife ................................................................................... 52,817 74Visit parks or natural areas 1 ........................................................................ 12,311 17Maintain plantings or natural areas .................................................................. 13,399 191Includes visits only to parks or natural areas within one mile <strong>of</strong> home.Note: Detail does not add to total because <strong>of</strong> multiple responses.Table 36. Participants, Area Visited, Trips, <strong>and</strong> Days <strong>of</strong> Participation in <strong>Wildlife</strong> WatchingAway From Home: 2011(Population 16 years old <strong>and</strong> older. Numbers in thous<strong>and</strong>s)PARTICIPANTSParticipants, area visited, trips, <strong>and</strong> days <strong>of</strong> participation Number PercentTotal participants ................................................................................... 22,496 100Observe wildlife ................................................................................. 19,808 88Photograph wildlife ............................................................................... 12,354 55Feed wildlife .................................................................................... 5,399 24AREA VISITEDTotal, all areas ...................................................................................... 22,496 100Public only ....................................................................................... 12,830 57Private only ....................................................................................... 2,105 9Public <strong>and</strong> private .................................................................................. 5,545 25Not reported ...................................................................................... 2,017 9TRIPSTotal trips .......................................................................................... 242,838 100Average days per trip. . . . . . . . . . . . . . . . . . . . . . . . . . . . . . . . . . . . . . . . . . . . . . . . . . . . . . . . . . . . . . . . . . . . . . . . . . . . . . . . 1 (X)DAYSTotal days .......................................................................................... 335,625 100Observing wildlife ................................................................................. 268,798 80Photographing wildlife .............................................................................. 110,459 33Feeding wildlife ................................................................................... 59,255 18Average days per participant .......................................................................... 15 (X)Observing wildlife ................................................................................. 14 (X)Photographing wildlife .............................................................................. 9 (X)Feeding wildlife ................................................................................... 11 (X)(X) Not applicable.Note: Detail does not add to total because <strong>of</strong> multiple responses.U.S. Fish <strong>and</strong> <strong>Wildlife</strong> Service <strong>and</strong> U.S. Census Bureau 2011 <strong>National</strong> <strong>Survey</strong> <strong>of</strong> <strong>Fishing</strong>, <strong>Hunting</strong>, <strong>and</strong> <strong>Wildlife</strong>-Associated Recreation 85
- Page 1:
U.S. Fish & Wildlife Service2011Nat
- Page 4 and 5:
Economics and StatisticsAdministrat
- Page 6 and 7:
List of TablesFishing and Hunting1.
- Page 8 and 9:
ForewordWhen I was growing up, it w
- Page 11 and 12:
Highlights
- Page 13 and 14:
watching (observing, photographing,
- Page 15 and 16:
Expenditures for Wildlife-Related R
- Page 17 and 18:
Fishing
- Page 19 and 20:
Fishing ExpendituresAnglers spent $
- Page 21 and 22:
Freshwater Fishing ExpendituresAngl
- Page 23 and 24:
pike, pickerel, and muskie, as well
- Page 25 and 26:
Sex and Age of AnglersAlthough more
- Page 27 and 28:
The majority of anglers had househo
- Page 29:
2001-2011 Fishing Participants, Day
- Page 32 and 33:
Hunting HighlightsIn 2011, 13.7 mil
- Page 34 and 35:
Big Game HuntingIn 2011, a majority
- Page 36 and 37:
Days per hunterTrips per hunterTrip
- Page 38 and 39:
Hunting on Public and PrivateLandsm
- Page 40 and 41:
Large MSA25%Medium MSA17%Percent of
- Page 42 and 43:
Hispanics, who represent a growingp
- Page 45 and 46: Wildlife WatchingU.S. Fish and Wild
- Page 47 and 48: Wildlife-Watching ExpendituresThirt
- Page 49 and 50: Wildlife Fed, Observed, orPhotograp
- Page 51 and 52: Metropolitan and NonmetropolitanAro
- Page 53 and 54: Education, Race, and Ethnicity ofAr
- Page 55 and 56: Away-From-Home Participantsby Type
- Page 57 and 58: Away-From-Home WildlifeWatchers by
- Page 59 and 60: Metropolitan and NonmetropolitanAwa
- Page 61 and 62: 2001-2011 Comparison of Wildlife-Wa
- Page 63: 2006-2011 Wildlife-Watching Partici
- Page 66 and 67: Guide to Statistical TablesPurpose
- Page 68 and 69: Table 3. Freshwater Anglers and Day
- Page 70 and 71: Table 7. Hunters and Days of Huntin
- Page 72 and 73: Table 8. Selected Characteristics o
- Page 74 and 75: Table 9. Selected Characteristics o
- Page 76 and 77: Table 10. Selected Characteristics
- Page 78 and 79: Table 12. Expenditures for Fishing:
- Page 80 and 81: Table 14. Trip and Equipment Expend
- Page 82 and 83: Table 16. Trip and Equipment Expend
- Page 84 and 85: Table 18. Trip and Equipment Expend
- Page 86 and 87: Table 20. Trip and Equipment Expend
- Page 88 and 89: Table 22. Special Equipment Expendi
- Page 90 and 91: Table 25. Freshwater Anglers and Da
- Page 92 and 93: Table 29. Hunters and Days of Hunti
- Page 96 and 97: Table 37. Participation in Wildlife
- Page 98 and 99: Table 40. Expenditures for Wildlife
- Page 100 and 101: Table 41. Selected Characteristics
- Page 102 and 103: Table 42. Selected Characteristics
- Page 104 and 105: Table 46. Total Wildlife-Related Pa
- Page 106 and 107: Appendix A.DefinitionsAnnual househ
- Page 108 and 109: State governments (such as State pa
- Page 110 and 111: Appendix B.2010 Participation of 6-
- Page 112 and 113: Table B-4. Most Recent Year of Fish
- Page 114 and 115: Table B-7. Selected Characteristics
- Page 116 and 117: Table B-9. Participation by 6-to-15
- Page 118 and 119: Appendix C.Significant Methodologic
- Page 120 and 121: Table C-1. Major Characteristics of
- Page 122 and 123: Table C-2. Anglers and Hunters by C
- Page 124 and 125: household income in the 2001Survey.
- Page 126 and 127: Table C-4. Comparison of Major Find
- Page 128 and 129: Table C-5. Anglers and Hunters by C
- Page 130 and 131: Appendix D.Sample Design and Statis
- Page 132 and 133: lation 6 to 15 years of age were de
- Page 134 and 135: compute in advance the standard err
- Page 136 and 137: Illustration of the Computation of
- Page 138 and 139: Table D-2. Approximate Standard Err
- Page 140 and 141: Table D-4. Approximate Standard Err
- Page 143: U.S. Department of the InteriorU.S.