Table 14. Trip <strong>and</strong> Equipment Expenditures for Freshwater <strong>Fishing</strong>, Except Great Lakes: 2011(Population 16 years old <strong>and</strong> older)Expenditure itemExpendituresAmount(thous<strong>and</strong>s<strong>of</strong> dollars)Averageper angler(dollars) 1Number(thous<strong>and</strong>s)SpendersPercent <strong>of</strong>anglersAverage perspender(dollars) 1Total, all items ................................................................... 23,782,678 879 24,989 92 952TRIP-RELATED EXPENDITURESTotal trip-related ................................................................. 13,373,390 494 24,539 91 545Food <strong>and</strong> lodging, total ............................................................ 4,960,614 183 20,962 77 237Food ......................................................................... 3,583,331 132 20,823 77 172Lodging ....................................................................... 1,377,283 51 4,324 16 319Transportation, total .............................................................. 4,462,519 165 21,091 78 212Public ........................................................................ 466,090 17 1,344 5 347Private ........................................................................ 3,996,429 148 20,591 76 194Other trip costs, total ............................................................. 3,950,256 146 20,600 76 192Guide fees, pack trip or package fees ................................................ 469,003 17 1,289 5 364Public l<strong>and</strong> use fees .............................................................. 173,406 6 3,477 13 50Private l<strong>and</strong> use fees ............................................................. 107,225 4 1,381 5 78Equipment rental ................................................................ 158,371 6 1,336 5 119Boating costs 2 .................................................................. 1,695,453 63 5,847 22 290Bait .......................................................................... 896,405 33 16,299 60 55Ice ........................................................................... 309,180 11 10,897 40 28Heating <strong>and</strong> cooking fuel ......................................................... 141,213 5 3,292 12 43EQUIPMENT EXPENDITURES<strong>Fishing</strong> equipment, total ........................................................... 3,971,636 147 16,440 61 242Rods, reels, poles, <strong>and</strong> rodmaking components ........................................ 1,534,749 57 7,883 29 195Lines <strong>and</strong> leaders ................................................................ 360,198 13 9,836 36 37Artificial lures, flies, baits, <strong>and</strong> dressing for flies or lines ................................ 871,255 32 11,871 44 73Hooks, sinkers, swivels, <strong>and</strong> other items attached to a line except lures <strong>and</strong> baits ............. 376,457 14 11,826 44 32Tackle boxes ................................................................... 87,079 3 2,834 10 31Creels, stringers, fish bags, l<strong>and</strong>ing nets, <strong>and</strong> gaff hooks ................................. 86,298 3 2,573 10 34Minnow traps, seines, <strong>and</strong> bait containers ............................................ 38,918 1 2,096 8 19Depth finders, fish finders, <strong>and</strong> other electronic fishing devices ........................... 284,072 10 691 3 411Ice fishing equipment ............................................................ 178,447 7 605 2 295Other fishing equipment .......................................................... 154,162 6 2,520 9 61Auxiliary equipment, total ......................................................... 560,314 21 2,598 10 216Camping equipment ............................................................. 138,054 5 764 3 181Binoculars, field glasses, telescopes, etc. ............................................. 65,985 2 242 1 273Special fishing clothing, rubber boots, waders, <strong>and</strong> foul weather gear ...................... 182,239 7 1,573 6 116Processing <strong>and</strong> taxidermy costs .................................................... *26,581 *1 *71 *(Z) *372Other ......................................................................... 147,456 5 462 2 319Special equipment 3 ............................................................... 5,877,338 217 1,653 6 3,555* Estimate based on a sample size <strong>of</strong> 10–29. (Z) Less than 0.5 percent.1Average expenditures are annual estimates.2Boating costs include launching, mooring, storage, maintenance, insurance, pumpout fees, <strong>and</strong> fuel.3Special equipment includes boats, campers, cabins, trail bikes, dune buggies, 4 x 4 vehicles, ATVs, 4-wheelers, snowmobiles, pickups, vans, travel <strong>and</strong> tent trailers, motor homes,house trailers, recreational vehicles (RVs) <strong>and</strong> other special equipment.Note: Detail does not add to total because <strong>of</strong> multiple responses.70 2011 <strong>National</strong> <strong>Survey</strong> <strong>of</strong> <strong>Fishing</strong>, <strong>Hunting</strong>, <strong>and</strong> <strong>Wildlife</strong>-Associated Recreation U.S. Fish <strong>and</strong> <strong>Wildlife</strong> Service <strong>and</strong> U.S. Census Bureau
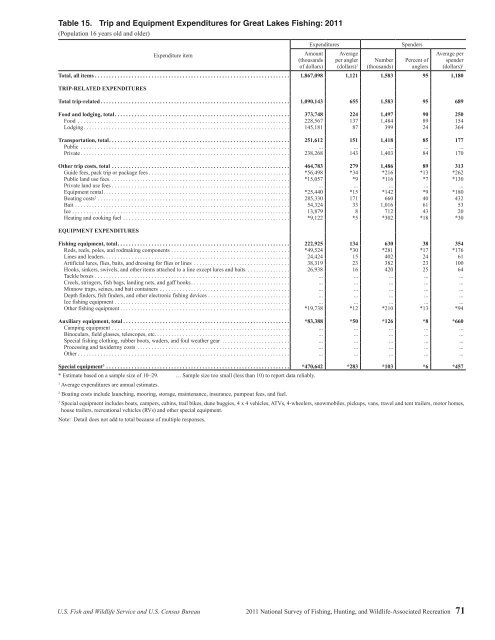
Table 15. Trip <strong>and</strong> Equipment Expenditures for Great Lakes <strong>Fishing</strong>: 2011(Population 16 years old <strong>and</strong> older)Expenditure itemExpendituresAmount(thous<strong>and</strong>s<strong>of</strong> dollars)Averageper angler(dollars) 1Number(thous<strong>and</strong>s)SpendersPercent <strong>of</strong>anglersAverage perspender(dollars) 1Total, all items ..................................................................... 1,867,098 1,121 1,583 95 1,180TRIP-RELATED EXPENDITURESTotal trip-related ................................................................... 1,090,143 655 1,583 95 689Food <strong>and</strong> lodging, total .............................................................. 373,748 224 1,497 90 250Food ........................................................................... 228,567 137 1,484 89 154Lodging ......................................................................... 145,181 87 399 24 364Transportation, total ................................................................ 251,612 151 1,418 85 177Public .......................................................................... ... ... ... ... ...Private .......................................................................... 238,268 143 1,403 84 170Other trip costs, total ............................................................... 464,783 279 1,486 89 313Guide fees, pack trip or package fees .................................................. *56,498 *34 *216 *13 *262Public l<strong>and</strong> use fees ................................................................ *15,057 *9 *116 *7 *130Private l<strong>and</strong> use fees ............................................................... ... ... ... ... ...Equipment rental .................................................................. *25,440 *15 *142 *9 *180Boating costs 2 .................................................................... 285,330 171 660 40 432Bait ............................................................................ 54,324 33 1,016 61 53Ice ............................................................................. 13,879 8 712 43 20Heating <strong>and</strong> cooking fuel ........................................................... *9,122 *5 *302 *18 *30EQUIPMENT EXPENDITURES<strong>Fishing</strong> equipment, total ............................................................. 222,925 134 630 38 354Rods, reels, poles, <strong>and</strong> rodmaking components .......................................... *49,524 *30 *281 *17 *176Lines <strong>and</strong> leaders .................................................................. 24,424 15 402 24 61Artificial lures, flies, baits, <strong>and</strong> dressing for flies or lines .................................. 38,319 23 382 23 100Hooks, sinkers, swivels, <strong>and</strong> other items attached to a line except lures <strong>and</strong> baits ............... 26,938 16 420 25 64Tackle boxes ..................................................................... ... ... ... ... ...Creels, stringers, fish bags, l<strong>and</strong>ing nets, <strong>and</strong> gaff hooks ................................... ... ... ... ... ...Minnow traps, seines, <strong>and</strong> bait containers .............................................. ... ... ... ... ...Depth finders, fish finders, <strong>and</strong> other electronic fishing devices ............................. ... ... ... ... ...Ice fishing equipment .............................................................. ... ... ... ... ...Other fishing equipment ............................................................ *19,738 *12 *210 *13 *94Auxiliary equipment, total ........................................................... *83,388 *50 *126 *8 *660Camping equipment ............................................................... ... ... ... ... ...Binoculars, field glasses, telescopes, etc. ............................................... ... ... ... ... ...Special fishing clothing, rubber boots, waders, <strong>and</strong> foul weather gear ........................ ... ... ... ... ...Processing <strong>and</strong> taxidermy costs ...................................................... ... ... ... ... ...Other ........................................................................... ... ... ... ... ...Special equipment 3 ................................................................. *470,642 *283 *103 *6 *457* Estimate based on a sample size <strong>of</strong> 10–29. … Sample size too small (less than 10) to report data reliably.1Average expenditures are annual estimates.2Boating costs include launching, mooring, storage, maintenance, insurance, pumpout fees, <strong>and</strong> fuel.3Special equipment includes boats, campers, cabins, trail bikes, dune buggies, 4 x 4 vehicles, ATVs, 4-wheelers, snowmobiles, pickups, vans, travel <strong>and</strong> tent trailers, motor homes,house trailers, recreational vehicles (RVs) <strong>and</strong> other special equipment.Note: Detail does not add to total because <strong>of</strong> multiple responses.U.S. Fish <strong>and</strong> <strong>Wildlife</strong> Service <strong>and</strong> U.S. Census Bureau 2011 <strong>National</strong> <strong>Survey</strong> <strong>of</strong> <strong>Fishing</strong>, <strong>Hunting</strong>, <strong>and</strong> <strong>Wildlife</strong>-Associated Recreation 71
- Page 1:
U.S. Fish & Wildlife Service2011Nat
- Page 4 and 5:
Economics and StatisticsAdministrat
- Page 6 and 7:
List of TablesFishing and Hunting1.
- Page 8 and 9:
ForewordWhen I was growing up, it w
- Page 11 and 12:
Highlights
- Page 13 and 14:
watching (observing, photographing,
- Page 15 and 16:
Expenditures for Wildlife-Related R
- Page 17 and 18:
Fishing
- Page 19 and 20:
Fishing ExpendituresAnglers spent $
- Page 21 and 22:
Freshwater Fishing ExpendituresAngl
- Page 23 and 24:
pike, pickerel, and muskie, as well
- Page 25 and 26:
Sex and Age of AnglersAlthough more
- Page 27 and 28:
The majority of anglers had househo
- Page 29: 2001-2011 Fishing Participants, Day
- Page 32 and 33: Hunting HighlightsIn 2011, 13.7 mil
- Page 34 and 35: Big Game HuntingIn 2011, a majority
- Page 36 and 37: Days per hunterTrips per hunterTrip
- Page 38 and 39: Hunting on Public and PrivateLandsm
- Page 40 and 41: Large MSA25%Medium MSA17%Percent of
- Page 42 and 43: Hispanics, who represent a growingp
- Page 45 and 46: Wildlife WatchingU.S. Fish and Wild
- Page 47 and 48: Wildlife-Watching ExpendituresThirt
- Page 49 and 50: Wildlife Fed, Observed, orPhotograp
- Page 51 and 52: Metropolitan and NonmetropolitanAro
- Page 53 and 54: Education, Race, and Ethnicity ofAr
- Page 55 and 56: Away-From-Home Participantsby Type
- Page 57 and 58: Away-From-Home WildlifeWatchers by
- Page 59 and 60: Metropolitan and NonmetropolitanAwa
- Page 61 and 62: 2001-2011 Comparison of Wildlife-Wa
- Page 63: 2006-2011 Wildlife-Watching Partici
- Page 66 and 67: Guide to Statistical TablesPurpose
- Page 68 and 69: Table 3. Freshwater Anglers and Day
- Page 70 and 71: Table 7. Hunters and Days of Huntin
- Page 72 and 73: Table 8. Selected Characteristics o
- Page 74 and 75: Table 9. Selected Characteristics o
- Page 76 and 77: Table 10. Selected Characteristics
- Page 78 and 79: Table 12. Expenditures for Fishing:
- Page 82 and 83: Table 16. Trip and Equipment Expend
- Page 84 and 85: Table 18. Trip and Equipment Expend
- Page 86 and 87: Table 20. Trip and Equipment Expend
- Page 88 and 89: Table 22. Special Equipment Expendi
- Page 90 and 91: Table 25. Freshwater Anglers and Da
- Page 92 and 93: Table 29. Hunters and Days of Hunti
- Page 94 and 95: Table 33. Hunters Preparing for Hun
- Page 96 and 97: Table 37. Participation in Wildlife
- Page 98 and 99: Table 40. Expenditures for Wildlife
- Page 100 and 101: Table 41. Selected Characteristics
- Page 102 and 103: Table 42. Selected Characteristics
- Page 104 and 105: Table 46. Total Wildlife-Related Pa
- Page 106 and 107: Appendix A.DefinitionsAnnual househ
- Page 108 and 109: State governments (such as State pa
- Page 110 and 111: Appendix B.2010 Participation of 6-
- Page 112 and 113: Table B-4. Most Recent Year of Fish
- Page 114 and 115: Table B-7. Selected Characteristics
- Page 116 and 117: Table B-9. Participation by 6-to-15
- Page 118 and 119: Appendix C.Significant Methodologic
- Page 120 and 121: Table C-1. Major Characteristics of
- Page 122 and 123: Table C-2. Anglers and Hunters by C
- Page 124 and 125: household income in the 2001Survey.
- Page 126 and 127: Table C-4. Comparison of Major Find
- Page 128 and 129: Table C-5. Anglers and Hunters by C
- Page 130 and 131:
Appendix D.Sample Design and Statis
- Page 132 and 133:
lation 6 to 15 years of age were de
- Page 134 and 135:
compute in advance the standard err
- Page 136 and 137:
Illustration of the Computation of
- Page 138 and 139:
Table D-2. Approximate Standard Err
- Page 140 and 141:
Table D-4. Approximate Standard Err
- Page 143:
U.S. Department of the InteriorU.S.