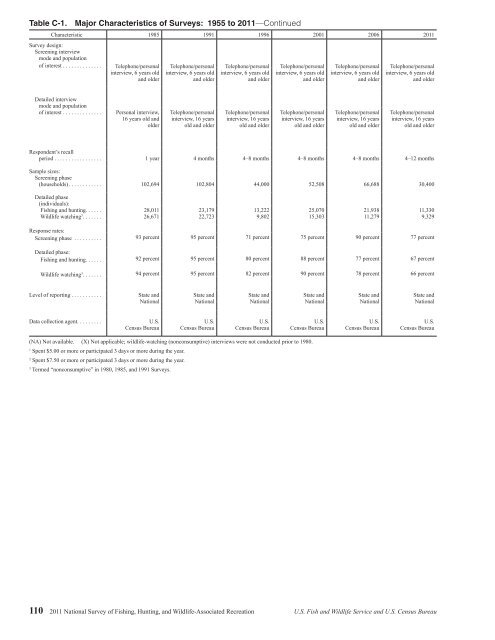
Table C-1. Major Characteristics <strong>of</strong> <strong>Survey</strong>s: 1955 to 2011—ContinuedCharacteristic 1985 1991 1996 2001 2006 2011<strong>Survey</strong> design:Screening interviewmode <strong>and</strong> population<strong>of</strong> interest ..............Telephone/personalinterview, 6 years old<strong>and</strong> olderTelephone/personalinterview, 6 years old<strong>and</strong> olderTelephone/personalinterview, 6 years old<strong>and</strong> olderTelephone/personalinterview, 6 years old<strong>and</strong> olderTelephone/personalinterview, 6 years old<strong>and</strong> olderTelephone/personalinterview, 6 years old<strong>and</strong> olderDetailed interviewmode <strong>and</strong> population<strong>of</strong> interest ..............Personal interview,16 years old <strong>and</strong>olderTelephone/personalinterview, 16 yearsold <strong>and</strong> olderTelephone/personalinterview, 16 yearsold <strong>and</strong> olderTelephone/personalinterview, 16 yearsold <strong>and</strong> olderTelephone/personalinterview, 16 yearsold <strong>and</strong> olderTelephone/personalinterview, 16 yearsold <strong>and</strong> olderRespondent’s recallperiod ................. 1 year 4 months 4–8 months 4–8 months 4–8 months 4–12 monthsSample sizes:Screening phase(households)............ 102,694 102,804 44,000 52,508 66,688 30,400Detailed phase(individuals):<strong>Fishing</strong> <strong>and</strong> hunting. . . . . . 28,011 23,179 13,222 25,070 21,938 11,330<strong>Wildlife</strong> watching 3 ....... 26,671 22,723 9,802 15,303 11,279 9,329Response rates:Screening phase .......... 93 percent 95 percent 71 percent 75 percent 90 percent 77 percentDetailed phase:<strong>Fishing</strong> <strong>and</strong> hunting. . . . . . 92 percent 95 percent 80 percent 88 percent 77 percent 67 percent<strong>Wildlife</strong> watching 3 ....... 94 percent 95 percent 82 percent 90 percent 78 percent 66 percentLevel <strong>of</strong> reporting ...........State <strong>and</strong><strong>National</strong>State <strong>and</strong><strong>National</strong>State <strong>and</strong><strong>National</strong>State <strong>and</strong><strong>National</strong>State <strong>and</strong><strong>National</strong>State <strong>and</strong><strong>National</strong>Data collection agent .........U.S.Census BureauU.S.Census BureauU.S.Census BureauU.S.Census BureauU.S.Census BureauU.S.Census Bureau(NA) Not available. (X) Not applicable; wildlife-watching (nonconsumptive) interviews were not conducted prior to 1980.1Spent $5.00 or more or participated 3 days or more during the year.2Spent $7.50 or more or participated 3 days or more during the year.3Termed “nonconsumptive” in 1980, 1985, <strong>and</strong> 1991 <strong>Survey</strong>s.110 2011 <strong>National</strong> <strong>Survey</strong> <strong>of</strong> <strong>Fishing</strong>, <strong>Hunting</strong>, <strong>and</strong> <strong>Wildlife</strong>-Associated Recreation U.S. Fish <strong>and</strong> <strong>Wildlife</strong> Service <strong>and</strong> U.S. Census Bureau
In the 1991 <strong>Survey</strong>, an attempt wasmade to contact every sample personin all three detailed interview waves.In 1996, 2001, 2006, <strong>and</strong> 2011respondents who were interviewedin the first detailed interview wavewere not contacted again until thethird wave (unless they were part <strong>of</strong>the other subsample, i.e., a respondentin both the sportsperson <strong>and</strong> wildlifewatching subsamples could be in thefirst <strong>and</strong> third wave <strong>of</strong> sportspersoninterviewing <strong>and</strong> the second <strong>and</strong> thirdwave <strong>of</strong> wildlife watching interviewing).Also, all interviews in thesecond wave were conducted only bytelephone. In-person interviews wereonly conducted in the first <strong>and</strong> thirdwaves. The 2011 wave 3 screen phasewas composed <strong>of</strong> both telephone <strong>and</strong>in-person interviews.Section I. Important InstrumentChanges in the 1996 <strong>Survey</strong>1. The 1991 <strong>Survey</strong> collectedinformation on all wildlife-relatedrecreation purchases made byparticipants without reference towhere the purchase was made. The1996 <strong>Survey</strong> asked in which statethe purchase was made.2. In 1991, respondents were askedwhat kind <strong>of</strong> fishing they did, i.e.,Great Lakes, other freshwater, orsaltwater, <strong>and</strong> then were askedin what states they fished. In1996, respondents were asked inwhich states they fished <strong>and</strong> thenwere asked what kind <strong>of</strong> fishingthey did. This method had theadvantage <strong>of</strong> not asking about, forexample, saltwater fishing whenthey only fished in a noncoastalstate.3. In 1991, respondents were askedhow many days they “actually”hunted or fished for a particulartype <strong>of</strong> game or fish <strong>and</strong> then howmany days they “chiefly” huntedor fished for the same type <strong>of</strong>game or fish rather than anothertype <strong>of</strong> game or fish. To get totaldays <strong>of</strong> hunting or fishing for aparticular type <strong>of</strong> game or fish, the“actually” day response was used,while to get the sum <strong>of</strong> all days <strong>of</strong>hunting or fishing, the “chiefly”days were summed. In 1996,respondents were asked their totaldays <strong>of</strong> hunting or fishing in thecountry <strong>and</strong> each state, then howmany days they hunted or fishedfor a particular type <strong>of</strong> game orfish.4. Trip-related <strong>and</strong> equipment expenditurecategories were not the samefor all <strong>Survey</strong>s. “Guide fee” <strong>and</strong>“Pack trip or package fee” weretwo separate trip-related expenditureitems in 1991, while they werecombined into one category inthe 1996 <strong>Survey</strong>. “Boating costs”was added to the 1996 hunting<strong>and</strong> wildlife-watching trip-relatedexpenditure sections. “Heating<strong>and</strong> cooking fuel” was added toall <strong>of</strong> the trip-related expendituresections. “Spearfishing equipment”was moved from a separatecategory to the “other” list. “Rods”<strong>and</strong> “Reels” were two separatecategories in 1991 but werecombined in 1996. “Lines, hooks,sinkers, etc.” was one categoryin 1991 but split into “Lines” <strong>and</strong>“Hooks, sinkers, etc.” in 1996.“Food used to feed other wildlife”was added to the wildlife-watchingequipment section, “Boats” <strong>and</strong>“Cabins” were added to thewildlife-watching special equipmentsection, <strong>and</strong> “L<strong>and</strong> leasing<strong>and</strong> ownership” was added to thewildlife-watching expendituressection.5. Questions asking sportspersons ifthey participated as much as theywanted were added in 1996. If thesportspersons said no, they wereasked why not.6. The 1991 <strong>Survey</strong> includedquestions about participation inorganized fishing competitions;anglers using bows <strong>and</strong> arrows,nets or seines, or spearfishing;hunters using pistols or h<strong>and</strong>guns<strong>and</strong> target shooting in preparationfor hunting. These questions werenot asked in 1996.7. The 1996 <strong>Survey</strong> included questionsabout catch <strong>and</strong> releasefishing <strong>and</strong> persons with disabilitiesparticipating in wildliferelatedrecreation. These questionswere not part <strong>of</strong> the 1991 <strong>Survey</strong>.8. The 1991 <strong>Survey</strong> included questionsabout average distancetraveled to recreation sites. Thesequestions were not included in the1996 <strong>Survey</strong>.9. The 1996 <strong>Survey</strong> includedquestions about the last trip therespondent took. Included werequestions about the type <strong>of</strong> trip,where the activity took place, <strong>and</strong>the distance <strong>and</strong> direction to thesite visited. These questions werenot asked in 1991.10. The 1991 <strong>Survey</strong> collected dataon hunting, fishing, <strong>and</strong> wildlifewatching by U.S. residentsin Canada. The 1996 <strong>Survey</strong>collected data on fishing <strong>and</strong> wildlife-watchingby U.S. residents inCanada.Section II. Important instrumentchanges in the 2001 <strong>Survey</strong>1. The 1991 <strong>and</strong> 1996 single racecategory “Asian or PacificIsl<strong>and</strong>er” was changed to twocategories “Asian” <strong>and</strong> “NativeHawaiian or Other PacificIsl<strong>and</strong>er”. In 1991 <strong>and</strong> 1996, therespondent was required to pickonly one category, while in 2001the respondent could pick anycombination <strong>of</strong> categories. Thenext question stipulated that therespondent could only be identifiedwith one category <strong>and</strong> then askedwhat that category was.2. The 1991 <strong>and</strong> 1996 l<strong>and</strong> leasing<strong>and</strong> ownership sections asked therespondent to combine the twotypes <strong>of</strong> l<strong>and</strong> use into one <strong>and</strong> givetotal acreage <strong>and</strong> expenditures. In2001, the two types <strong>of</strong> l<strong>and</strong> usewere explored separately.3. The 1991 <strong>and</strong> 1996 wildlifewatchingsections included questionson birdwatching for aroundthe-homeparticipants only. The2001 <strong>Survey</strong> added a question onbirdwatching for away-from-homeparticipants. Also, questions on theuse <strong>of</strong> birding life lists <strong>and</strong> howmany species the respondent canidentify were added.4. “Recreational vehicles” was addedto the sportspersons <strong>and</strong> wildlifewatchersspecial equipmentsection. “House trailer” was addedto the sportspersons special equipmentsection.5. Total personal income was askedin the detailed phase <strong>of</strong> the 1996<strong>Survey</strong>. This was changed to totalU.S. Fish <strong>and</strong> <strong>Wildlife</strong> Service <strong>and</strong> U.S. Census Bureau 2011 <strong>National</strong> <strong>Survey</strong> <strong>of</strong> <strong>Fishing</strong>, <strong>Hunting</strong>, <strong>and</strong> <strong>Wildlife</strong>-Associated Recreation 111
- Page 1:
U.S. Fish & Wildlife Service2011Nat
- Page 4 and 5:
Economics and StatisticsAdministrat
- Page 6 and 7:
List of TablesFishing and Hunting1.
- Page 8 and 9:
ForewordWhen I was growing up, it w
- Page 11 and 12:
Highlights
- Page 13 and 14:
watching (observing, photographing,
- Page 15 and 16:
Expenditures for Wildlife-Related R
- Page 17 and 18:
Fishing
- Page 19 and 20:
Fishing ExpendituresAnglers spent $
- Page 21 and 22:
Freshwater Fishing ExpendituresAngl
- Page 23 and 24:
pike, pickerel, and muskie, as well
- Page 25 and 26:
Sex and Age of AnglersAlthough more
- Page 27 and 28:
The majority of anglers had househo
- Page 29:
2001-2011 Fishing Participants, Day
- Page 32 and 33:
Hunting HighlightsIn 2011, 13.7 mil
- Page 34 and 35:
Big Game HuntingIn 2011, a majority
- Page 36 and 37:
Days per hunterTrips per hunterTrip
- Page 38 and 39:
Hunting on Public and PrivateLandsm
- Page 40 and 41:
Large MSA25%Medium MSA17%Percent of
- Page 42 and 43:
Hispanics, who represent a growingp
- Page 45 and 46:
Wildlife WatchingU.S. Fish and Wild
- Page 47 and 48:
Wildlife-Watching ExpendituresThirt
- Page 49 and 50:
Wildlife Fed, Observed, orPhotograp
- Page 51 and 52:
Metropolitan and NonmetropolitanAro
- Page 53 and 54:
Education, Race, and Ethnicity ofAr
- Page 55 and 56:
Away-From-Home Participantsby Type
- Page 57 and 58:
Away-From-Home WildlifeWatchers by
- Page 59 and 60:
Metropolitan and NonmetropolitanAwa
- Page 61 and 62:
2001-2011 Comparison of Wildlife-Wa
- Page 63:
2006-2011 Wildlife-Watching Partici
- Page 66 and 67:
Guide to Statistical TablesPurpose
- Page 68 and 69:
Table 3. Freshwater Anglers and Day
- Page 70 and 71: Table 7. Hunters and Days of Huntin
- Page 72 and 73: Table 8. Selected Characteristics o
- Page 74 and 75: Table 9. Selected Characteristics o
- Page 76 and 77: Table 10. Selected Characteristics
- Page 78 and 79: Table 12. Expenditures for Fishing:
- Page 80 and 81: Table 14. Trip and Equipment Expend
- Page 82 and 83: Table 16. Trip and Equipment Expend
- Page 84 and 85: Table 18. Trip and Equipment Expend
- Page 86 and 87: Table 20. Trip and Equipment Expend
- Page 88 and 89: Table 22. Special Equipment Expendi
- Page 90 and 91: Table 25. Freshwater Anglers and Da
- Page 92 and 93: Table 29. Hunters and Days of Hunti
- Page 94 and 95: Table 33. Hunters Preparing for Hun
- Page 96 and 97: Table 37. Participation in Wildlife
- Page 98 and 99: Table 40. Expenditures for Wildlife
- Page 100 and 101: Table 41. Selected Characteristics
- Page 102 and 103: Table 42. Selected Characteristics
- Page 104 and 105: Table 46. Total Wildlife-Related Pa
- Page 106 and 107: Appendix A.DefinitionsAnnual househ
- Page 108 and 109: State governments (such as State pa
- Page 110 and 111: Appendix B.2010 Participation of 6-
- Page 112 and 113: Table B-4. Most Recent Year of Fish
- Page 114 and 115: Table B-7. Selected Characteristics
- Page 116 and 117: Table B-9. Participation by 6-to-15
- Page 118 and 119: Appendix C.Significant Methodologic
- Page 122 and 123: Table C-2. Anglers and Hunters by C
- Page 124 and 125: household income in the 2001Survey.
- Page 126 and 127: Table C-4. Comparison of Major Find
- Page 128 and 129: Table C-5. Anglers and Hunters by C
- Page 130 and 131: Appendix D.Sample Design and Statis
- Page 132 and 133: lation 6 to 15 years of age were de
- Page 134 and 135: compute in advance the standard err
- Page 136 and 137: Illustration of the Computation of
- Page 138 and 139: Table D-2. Approximate Standard Err
- Page 140 and 141: Table D-4. Approximate Standard Err
- Page 143: U.S. Department of the InteriorU.S.