Table 8. Selected Characteristics <strong>of</strong> Anglers <strong>and</strong> Hunters: 2011—Continued(Population 16 years old <strong>and</strong> older. Numbers in thous<strong>and</strong>s)CharacteristicNumberHunted onlyPercent whoparticipated Percent NumberFished <strong>and</strong> huntedPercent whoparticipatedTotal persons ......................................... 4,285 2 100 9,389 4 100Population Density <strong>of</strong> ResidenceUrban .............................................. 1,774 1 41 4,023 2 43Rural .............................................. 2,511 4 59 5,366 9 57Population Size <strong>of</strong> ResidenceMetropolitan Statistical Area (MSA) ..................... 3,306 1 77 7,610 3 811,000,000 or more .................................. 1,064 1 25 2,303 2 25250,000 to 999,999 ................................. 706 1 16 1,668 3 1850,000 to 249,999 .................................. 1,536 3 36 3,638 8 39Outside MSA ........................................ 979 6 23 1,780 12 19Census Geographic DivisionNew Engl<strong>and</strong> ........................................ 86 1 2 334 3 4Middle Atlantic ...................................... 471 1 11 1,087 3 12East North Central .................................... 905 3 21 1,783 5 19West North Central ................................... 390 2 9 1,271 8 14South Atlantic ....................................... 587 1 14 1,283 3 14East South Central .................................... 566 4 13 965 7 10West South Central ................................... 556 2 13 1,353 5 14Mountain ........................................... 390 2 9 653 4 7Pacific ............................................. 335 1 8 661 2 7Age16 to 17 years ....................................... *161 *2 *4 258 3 318 to 24 years ....................................... 218 1 5 1,070 4 1125 to 34 years ....................................... 616 1 14 1,463 4 1635 to 44 years ....................................... 761 2 18 1,654 4 1845 to 54 years ....................................... 937 2 22 2,206 5 2355 to 64 years ....................................... 1,000 3 23 1,842 5 2065 years <strong>and</strong> older .................................... 590 2 14 897 2 1065 to 74 years ..................................... 455 2 11 766 3 875 <strong>and</strong> older ....................................... 135 1 3 131 1 1SexMale, total .......................................... 3,867 3 90 8,351 7 8916 to 17 years ..................................... *106 *3 *2 224 6 218 to 24 years ..................................... 188 1 4 827 6 925 to 34 years ..................................... 561 3 13 1,225 6 1335 to 44 years ..................................... 676 3 16 1,560 8 1745 to 54 years ..................................... 831 4 19 1,921 9 2055 to 64 years ..................................... 980 5 23 1,734 9 1865 years <strong>and</strong> older .................................. 525 3 12 860 5 965 to 74 years ................................... 395 4 9 738 7 875 <strong>and</strong> older ..................................... 130 2 3 122 2 1Female, total ........................................ 418 (Z) 10 1,039 1 1116 to 17 years ..................................... ... ... ... ... ... ...18 to 24 years ..................................... ... ... ... *243 *2 *325 to 34 years ..................................... ... ... ... 238 1 335 to 44 years ..................................... *85 *(Z) *2 94 (Z) 145 to 54 years ..................................... *107 *(Z) *2 285 1 355 to 64 years ..................................... ... ... ... *108 *1 *165 years <strong>and</strong> older .................................. *65 *(Z) *2 *37 *(Z) *(Z)65 to 74 years ................................... ... ... ... *28 *(Z) *(Z)75 <strong>and</strong> older ..................................... ... ... ... ... ... ...EthnicityHispanic ........................................... *118 *(Z) *3 153 (Z) 2Non-Hispanic ....................................... 4,167 2 97 9,236 4 98RaceWhite .............................................. 4,146 2 97 8,706 5 93African American .................................... ... ... ... 358 2 4Asian American ...................................... ... ... ... *23 *(Z) *(Z)<strong>All</strong> others ........................................... *79 *(Z) *2 303 1 3Annual Household IncomeLess than $20,000 .................................... 343 1 8 648 2 7$20,000 to $24,999 ................................... *174 *1 *4 358 3 4$25,000 to $29,999 ................................... 117 1 3 378 4 4$30,000 to $34,999 ................................... 204 2 5 352 3 4$35,000 to $39,999 ................................... *193 *2 *4 413 4 4$40,000 to $49,999 ................................... 364 2 9 765 4 8$50,000 to $74,999 ................................... 874 3 20 1,737 5 18$75,000 to $99,999 ................................... 669 3 16 1,702 7 18$100,000 to $149,999 ................................. 669 3 16 1,263 5 13$150,000 or more .................................... 218 1 5 643 4 7Not reported ........................................ 460 1 11 1,131 2 12Education11 years or less ...................................... 521 2 12 961 3 1012 years ............................................ 1,826 2 43 3,149 4 341 to 3 years <strong>of</strong> college ................................. 991 2 23 2,519 5 274 years <strong>of</strong> college .................................... 653 2 15 1,794 4 195 years or more <strong>of</strong> college .............................. 293 1 7 967 3 10* Estimate based on a sample size <strong>of</strong> 10–29. … Sample size too small (less than 10) to report data reliably. (Z) Less than 0.5 percent.Note: Percent who participated columns show the percent <strong>of</strong> each row’s population who participated in the activity named by the column. Percent columns show the percent <strong>of</strong>each column’s participants who are described by the row heading. Demographic variables we could include but haven’t are (1) relationship to head <strong>of</strong> household, (2) maritalstatus, (3) population size <strong>of</strong> area participant grew up, (4) years participant lived in resident state, (5) whether or not participant has a job, <strong>and</strong> (6) whether or not participantis going to school, keeping house, or retired.Percent62 2011 <strong>National</strong> <strong>Survey</strong> <strong>of</strong> <strong>Fishing</strong>, <strong>Hunting</strong>, <strong>and</strong> <strong>Wildlife</strong>-Associated Recreation U.S. Fish <strong>and</strong> <strong>Wildlife</strong> Service <strong>and</strong> U.S. Census Bureau
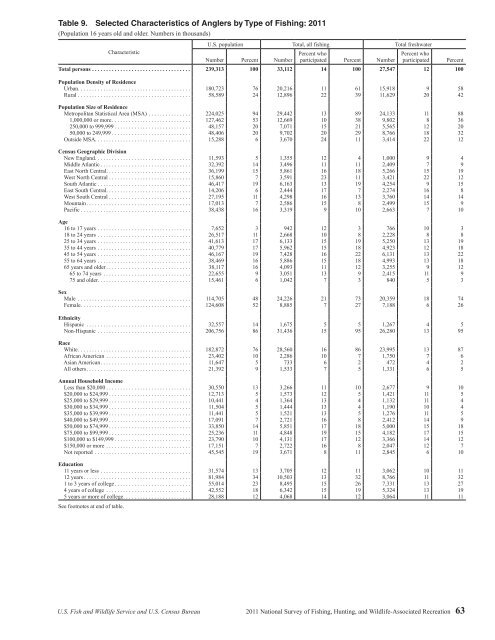
Table 9. Selected Characteristics <strong>of</strong> Anglers by Type <strong>of</strong> <strong>Fishing</strong>: 2011(Population 16 years old <strong>and</strong> older. Numbers in thous<strong>and</strong>s)CharacteristicU.S. population Total, all fishing Total freshwaterNumber Percent NumberPercent whoparticipated Percent NumberPercent whoparticipatedTotal persons ................................... 239,313 100 33,112 14 100 27,547 12 100Population Density <strong>of</strong> ResidenceUrban ........................................ 180,723 76 20,216 11 61 15,918 9 58Rural ........................................ 58,589 24 12,896 22 39 11,629 20 42Population Size <strong>of</strong> ResidenceMetropolitan Statistical Area (MSA) ............... 224,025 94 29,442 13 89 24,133 11 881,000,000 or more ............................ 127,462 53 12,669 10 38 9,802 8 36250,000 to 999,999 ........................... 48,157 20 7,071 15 21 5,565 12 2050,000 to 249,999 ............................ 48,406 20 9,702 20 29 8,766 18 32Outside MSA .................................. 15,288 6 3,670 24 11 3,414 22 12Census Geographic DivisionNew Engl<strong>and</strong> .................................. 11,593 5 1,355 12 4 1,000 9 4Middle Atlantic ................................ 32,392 14 3,496 11 11 2,409 7 9East North Central .............................. 36,199 15 5,861 16 18 5,266 15 19West North Central ............................. 15,860 7 3,591 23 11 3,421 22 12South Atlantic ................................. 46,417 19 6,163 13 19 4,254 9 15East South Central .............................. 14,206 6 2,444 17 7 2,274 16 8West South Central ............................. 27,195 11 4,298 16 13 3,760 14 14Mountain ..................................... 17,013 7 2,586 15 8 2,499 15 9Pacific ....................................... 38,438 16 3,319 9 10 2,663 7 10Age16 to 17 years ................................. 7,652 3 942 12 3 766 10 318 to 24 years ................................. 26,517 11 2,668 10 8 2,228 8 825 to 34 years ................................. 41,613 17 6,133 15 19 5,250 13 1935 to 44 years ................................. 40,779 17 5,962 15 18 4,923 12 1845 to 54 years ................................. 46,167 19 7,428 16 22 6,131 13 2255 to 64 years ................................. 38,469 16 5,886 15 18 4,993 13 1865 years <strong>and</strong> older .............................. 38,117 16 4,093 11 12 3,255 9 1265 to 74 years ............................... 22,655 9 3,051 13 9 2,415 11 975 <strong>and</strong> older ................................. 15,461 6 1,042 7 3 840 5 3SexMale ........................................ 114,705 48 24,226 21 73 20,359 18 74Female ....................................... 124,608 52 8,885 7 27 7,188 6 26EthnicityHispanic ..................................... 32,557 14 1,675 5 5 1,267 4 5Non-Hispanic ................................. 206,756 86 31,436 15 95 26,280 13 95RaceWhite ........................................ 182,872 76 28,560 16 86 23,995 13 87African American .............................. 23,402 10 2,286 10 7 1,750 7 6Asian American ................................ 11,647 5 733 6 2 472 4 2<strong>All</strong> others ..................................... 21,392 9 1,533 7 5 1,331 6 5Annual Household IncomeLess than $20,000 .............................. 30,550 13 3,266 11 10 2,677 9 10$20,000 to $24,999 ............................. 12,713 5 1,573 12 5 1,421 11 5$25,000 to $29,999 ............................. 10,441 4 1,364 13 4 1,132 11 4$30,000 to $34,999 ............................. 11,504 5 1,444 13 4 1,190 10 4$35,000 to $39,999 ............................. 11,441 5 1,521 13 5 1,276 11 5$40,000 to $49,999 ............................. 17,091 7 2,721 16 8 2,412 14 9$50,000 to $74,999 ............................. 33,850 14 5,851 17 18 5,000 15 18$75,000 to $99,999 ............................. 25,236 11 4,848 19 15 4,182 17 15$100,000 to $149,999 ........................... 23,790 10 4,131 17 12 3,366 14 12$150,000 or more .............................. 17,151 7 2,722 16 8 2,047 12 7Not reported .................................. 45,545 19 3,671 8 11 2,845 6 10Education11 years or less ................................ 31,574 13 3,705 12 11 3,062 10 1112 years ...................................... 81,984 34 10,503 13 32 8,766 11 321 to 3 years <strong>of</strong> college ........................... 55,014 23 8,495 15 26 7,331 13 274 years <strong>of</strong> college .............................. 42,552 18 6,342 15 19 5,324 13 195 years or more <strong>of</strong> college ........................ 28,188 12 4,068 14 12 3,064 11 11See footnotes at end <strong>of</strong> table.PercentU.S. Fish <strong>and</strong> <strong>Wildlife</strong> Service <strong>and</strong> U.S. Census Bureau 2011 <strong>National</strong> <strong>Survey</strong> <strong>of</strong> <strong>Fishing</strong>, <strong>Hunting</strong>, <strong>and</strong> <strong>Wildlife</strong>-Associated Recreation 63
- Page 1:
U.S. Fish & Wildlife Service2011Nat
- Page 4 and 5:
Economics and StatisticsAdministrat
- Page 6 and 7:
List of TablesFishing and Hunting1.
- Page 8 and 9:
ForewordWhen I was growing up, it w
- Page 11 and 12:
Highlights
- Page 13 and 14:
watching (observing, photographing,
- Page 15 and 16:
Expenditures for Wildlife-Related R
- Page 17 and 18:
Fishing
- Page 19 and 20:
Fishing ExpendituresAnglers spent $
- Page 21 and 22: Freshwater Fishing ExpendituresAngl
- Page 23 and 24: pike, pickerel, and muskie, as well
- Page 25 and 26: Sex and Age of AnglersAlthough more
- Page 27 and 28: The majority of anglers had househo
- Page 29: 2001-2011 Fishing Participants, Day
- Page 32 and 33: Hunting HighlightsIn 2011, 13.7 mil
- Page 34 and 35: Big Game HuntingIn 2011, a majority
- Page 36 and 37: Days per hunterTrips per hunterTrip
- Page 38 and 39: Hunting on Public and PrivateLandsm
- Page 40 and 41: Large MSA25%Medium MSA17%Percent of
- Page 42 and 43: Hispanics, who represent a growingp
- Page 45 and 46: Wildlife WatchingU.S. Fish and Wild
- Page 47 and 48: Wildlife-Watching ExpendituresThirt
- Page 49 and 50: Wildlife Fed, Observed, orPhotograp
- Page 51 and 52: Metropolitan and NonmetropolitanAro
- Page 53 and 54: Education, Race, and Ethnicity ofAr
- Page 55 and 56: Away-From-Home Participantsby Type
- Page 57 and 58: Away-From-Home WildlifeWatchers by
- Page 59 and 60: Metropolitan and NonmetropolitanAwa
- Page 61 and 62: 2001-2011 Comparison of Wildlife-Wa
- Page 63: 2006-2011 Wildlife-Watching Partici
- Page 66 and 67: Guide to Statistical TablesPurpose
- Page 68 and 69: Table 3. Freshwater Anglers and Day
- Page 70 and 71: Table 7. Hunters and Days of Huntin
- Page 74 and 75: Table 9. Selected Characteristics o
- Page 76 and 77: Table 10. Selected Characteristics
- Page 78 and 79: Table 12. Expenditures for Fishing:
- Page 80 and 81: Table 14. Trip and Equipment Expend
- Page 82 and 83: Table 16. Trip and Equipment Expend
- Page 84 and 85: Table 18. Trip and Equipment Expend
- Page 86 and 87: Table 20. Trip and Equipment Expend
- Page 88 and 89: Table 22. Special Equipment Expendi
- Page 90 and 91: Table 25. Freshwater Anglers and Da
- Page 92 and 93: Table 29. Hunters and Days of Hunti
- Page 94 and 95: Table 33. Hunters Preparing for Hun
- Page 96 and 97: Table 37. Participation in Wildlife
- Page 98 and 99: Table 40. Expenditures for Wildlife
- Page 100 and 101: Table 41. Selected Characteristics
- Page 102 and 103: Table 42. Selected Characteristics
- Page 104 and 105: Table 46. Total Wildlife-Related Pa
- Page 106 and 107: Appendix A.DefinitionsAnnual househ
- Page 108 and 109: State governments (such as State pa
- Page 110 and 111: Appendix B.2010 Participation of 6-
- Page 112 and 113: Table B-4. Most Recent Year of Fish
- Page 114 and 115: Table B-7. Selected Characteristics
- Page 116 and 117: Table B-9. Participation by 6-to-15
- Page 118 and 119: Appendix C.Significant Methodologic
- Page 120 and 121: Table C-1. Major Characteristics of
- Page 122 and 123:
Table C-2. Anglers and Hunters by C
- Page 124 and 125:
household income in the 2001Survey.
- Page 126 and 127:
Table C-4. Comparison of Major Find
- Page 128 and 129:
Table C-5. Anglers and Hunters by C
- Page 130 and 131:
Appendix D.Sample Design and Statis
- Page 132 and 133:
lation 6 to 15 years of age were de
- Page 134 and 135:
compute in advance the standard err
- Page 136 and 137:
Illustration of the Computation of
- Page 138 and 139:
Table D-2. Approximate Standard Err
- Page 140 and 141:
Table D-4. Approximate Standard Err
- Page 143:
U.S. Department of the InteriorU.S.