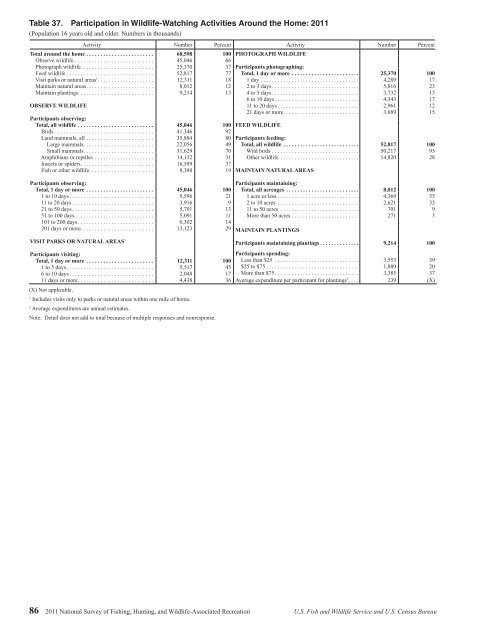
Table 37. Participation in <strong>Wildlife</strong>-Watching Activities Around the Home: 2011(Population 16 years old <strong>and</strong> older. Numbers in thous<strong>and</strong>s)Activity Number PercentTotal around the home ........................ 68,598 100Observe wildlife ............................ 45,046 66Photograph wildlife .......................... 25,370 37Feed wildlife ............................... 52,817 77Visit parks or natural areas 1 .................... 12,311 18Maintain natural areas ........................ 8,012 12Maintain plantings .......................... 9,214 13OBSERVE WILDLIFEParticipants observing:Total, all wildlife ........................... 45,046 100<strong>Birds</strong> ................................... 41,346 92L<strong>and</strong> mammals, all ........................ 35,884 80Large mammals ......................... 22,056 49Small mammals ......................... 31,629 70Amphibians or reptiles ..................... 14,132 31Insects or spiders .......................... 16,589 37Fish or other wildlife ....................... 8,388 19Participants observing:Total, 1 day or more ........................ 45,046 1001 to 10 days .............................. 9,596 2111 to 20 days ............................. 3,916 921 to 50 days ............................. 5,791 1351 to 100 days ............................ 5,091 11101 to 200 days ........................... 6,302 14201 days or more .......................... 13,123 29VISIT PARKS OR NATURAL AREAS 1Participants visiting:Total, 1 day or more ........................ 12,311 1001 to 5 days ............................... 5,517 456 to 10 days .............................. 2,048 1711 days or more ........................... 4,438 36(X) Not applicable.1Includes visits only to parks or natural areas within one mile <strong>of</strong> home.2Average expenditures are annual estimates.Note: Detail does not add to total because <strong>of</strong> multiple responses <strong>and</strong> nonresponse.PHOTOGRAPH WILDLIFEActivity Number PercentParticipants photographing:Total, 1 day or more ........................ 25,370 1001 day ................................... 4,289 172 to 3 days ............................... 5,816 234 to 5 days ............................... 3,732 156 to 10 days .............................. 4,343 1711 to 20 days ............................. 2,961 1221 days or more ........................... 3,689 15FEED WILDLIFEParticipants feeding:Total, all wildlife ........................... 52,817 100Wild birds ............................... 50,217 95Other wildlife ............................ 14,820 28MAINTAIN NATURAL AREASParticipants maintaining:Total, all acreages .......................... 8,012 1001 acre or less ............................. 4,369 552 to 10 acres ............................. 2,621 3311 to 50 acres ............................ 701 9More than 50 acres ........................ 271 3MAINTAIN PLANTINGSParticipants maintaining plantings .............. 9,214 100Participants spending:Less than $25 .............................. 3,553 39$25 to $75 ................................. 1,880 20More than $75 .............................. 3,385 37Average expenditure per participant for plantings 2 .... 239 (X)86 2011 <strong>National</strong> <strong>Survey</strong> <strong>of</strong> <strong>Fishing</strong>, <strong>Hunting</strong>, <strong>and</strong> <strong>Wildlife</strong>-Associated Recreation U.S. Fish <strong>and</strong> <strong>Wildlife</strong> Service <strong>and</strong> U.S. Census Bureau
Table 38. Away-From-Home <strong>Wildlife</strong> Watchers by <strong>Wildlife</strong> Observed, Photographed, orFed <strong>and</strong> Place: 2011(Population 16 years old <strong>and</strong> older. Numbers in thous<strong>and</strong>s)<strong>Wildlife</strong> observed, photographed, or fedTotal participantsParticipation by placeTotal In state <strong>of</strong> residence In other statesNumber Percent Number Percent Number Percent Number PercentTotal, all wildlife ...................................... 22,496 100 22,496 100 18,529 82 6,769 30Total birds ........................................... 18,924 84 18,924 100 16,037 85 6,257 33Songbirds (cardinals, robins, etc.) ........................ 12,120 54 12,120 100 10,616 88 3,356 28<strong>Birds</strong> <strong>of</strong> prey (hawks, eagles, etc.) ....................... 12,890 57 12,890 100 10,990 85 3,917 30Waterfowl (ducks, geese, etc.) .......................... 13,333 59 13,333 100 11,081 83 4,231 32Other water birds (shorebirds, herons, cranes, etc.) .......... 10,606 47 10,606 100 8,509 80 3,483 33Other birds (pheasants, turkeys, road runners, etc.) .......... 6,857 30 6,857 100 5,770 84 1,790 26Total l<strong>and</strong> mammals ................................... 13,653 61 13,653 100 11,743 86 4,180 31Large l<strong>and</strong> mammals (deer, bear, etc.) .................... 10,369 46 10,369 100 8,702 84 3,045 29Small l<strong>and</strong> mammals (squirrel, prairie dog, etc.) ............ 10,299 46 10,299 100 8,758 85 3,299 32Fish (salmon, shark, etc.) ................................ 6,358 28 6,358 100 4,964 78 2,075 33Marine mammals (whales, dolphins, etc.) ................... 4,008 18 4,008 100 2,325 58 1,864 47Other wildlife (turtles, butterflies, etc.) ..................... 10,113 45 10,113 100 8,602 85 2,865 28Note: Detail does not add to total because <strong>of</strong> multiple responses. Column showing percent <strong>of</strong> total participants is based on the “Total, all wildlife” numbers. “Participation byplace” percent columns are based on the total numbers <strong>of</strong> participants for each type <strong>of</strong> wildlife.Table 39. Wild Bird Observers <strong>and</strong> Days <strong>of</strong> Observation: 2011(Population 16 years old <strong>and</strong> older. Numbers in thous<strong>and</strong>s)OBSERVERSObservers <strong>and</strong> days <strong>of</strong> observation Number PercentTotal bird observers ................................................................. 46,741 100Around-the-home observers .......................................................... 41,346 88Away-from-home observers .......................................................... 17,818 38DAYSTotal days observing birds ............................................................ 5,161,909 100Around the home ................................................................... 4,923,873 95Away from home ................................................................... 238,036 5Note: Detail does not add to total because <strong>of</strong> multiple responses.U.S. Fish <strong>and</strong> <strong>Wildlife</strong> Service <strong>and</strong> U.S. Census Bureau 2011 <strong>National</strong> <strong>Survey</strong> <strong>of</strong> <strong>Fishing</strong>, <strong>Hunting</strong>, <strong>and</strong> <strong>Wildlife</strong>-Associated Recreation 87
- Page 1:
U.S. Fish & Wildlife Service2011Nat
- Page 4 and 5:
Economics and StatisticsAdministrat
- Page 6 and 7:
List of TablesFishing and Hunting1.
- Page 8 and 9:
ForewordWhen I was growing up, it w
- Page 11 and 12:
Highlights
- Page 13 and 14:
watching (observing, photographing,
- Page 15 and 16:
Expenditures for Wildlife-Related R
- Page 17 and 18:
Fishing
- Page 19 and 20:
Fishing ExpendituresAnglers spent $
- Page 21 and 22:
Freshwater Fishing ExpendituresAngl
- Page 23 and 24:
pike, pickerel, and muskie, as well
- Page 25 and 26:
Sex and Age of AnglersAlthough more
- Page 27 and 28:
The majority of anglers had househo
- Page 29:
2001-2011 Fishing Participants, Day
- Page 32 and 33:
Hunting HighlightsIn 2011, 13.7 mil
- Page 34 and 35:
Big Game HuntingIn 2011, a majority
- Page 36 and 37:
Days per hunterTrips per hunterTrip
- Page 38 and 39:
Hunting on Public and PrivateLandsm
- Page 40 and 41:
Large MSA25%Medium MSA17%Percent of
- Page 42 and 43:
Hispanics, who represent a growingp
- Page 45 and 46: Wildlife WatchingU.S. Fish and Wild
- Page 47 and 48: Wildlife-Watching ExpendituresThirt
- Page 49 and 50: Wildlife Fed, Observed, orPhotograp
- Page 51 and 52: Metropolitan and NonmetropolitanAro
- Page 53 and 54: Education, Race, and Ethnicity ofAr
- Page 55 and 56: Away-From-Home Participantsby Type
- Page 57 and 58: Away-From-Home WildlifeWatchers by
- Page 59 and 60: Metropolitan and NonmetropolitanAwa
- Page 61 and 62: 2001-2011 Comparison of Wildlife-Wa
- Page 63: 2006-2011 Wildlife-Watching Partici
- Page 66 and 67: Guide to Statistical TablesPurpose
- Page 68 and 69: Table 3. Freshwater Anglers and Day
- Page 70 and 71: Table 7. Hunters and Days of Huntin
- Page 72 and 73: Table 8. Selected Characteristics o
- Page 74 and 75: Table 9. Selected Characteristics o
- Page 76 and 77: Table 10. Selected Characteristics
- Page 78 and 79: Table 12. Expenditures for Fishing:
- Page 80 and 81: Table 14. Trip and Equipment Expend
- Page 82 and 83: Table 16. Trip and Equipment Expend
- Page 84 and 85: Table 18. Trip and Equipment Expend
- Page 86 and 87: Table 20. Trip and Equipment Expend
- Page 88 and 89: Table 22. Special Equipment Expendi
- Page 90 and 91: Table 25. Freshwater Anglers and Da
- Page 92 and 93: Table 29. Hunters and Days of Hunti
- Page 94 and 95: Table 33. Hunters Preparing for Hun
- Page 98 and 99: Table 40. Expenditures for Wildlife
- Page 100 and 101: Table 41. Selected Characteristics
- Page 102 and 103: Table 42. Selected Characteristics
- Page 104 and 105: Table 46. Total Wildlife-Related Pa
- Page 106 and 107: Appendix A.DefinitionsAnnual househ
- Page 108 and 109: State governments (such as State pa
- Page 110 and 111: Appendix B.2010 Participation of 6-
- Page 112 and 113: Table B-4. Most Recent Year of Fish
- Page 114 and 115: Table B-7. Selected Characteristics
- Page 116 and 117: Table B-9. Participation by 6-to-15
- Page 118 and 119: Appendix C.Significant Methodologic
- Page 120 and 121: Table C-1. Major Characteristics of
- Page 122 and 123: Table C-2. Anglers and Hunters by C
- Page 124 and 125: household income in the 2001Survey.
- Page 126 and 127: Table C-4. Comparison of Major Find
- Page 128 and 129: Table C-5. Anglers and Hunters by C
- Page 130 and 131: Appendix D.Sample Design and Statis
- Page 132 and 133: lation 6 to 15 years of age were de
- Page 134 and 135: compute in advance the standard err
- Page 136 and 137: Illustration of the Computation of
- Page 138 and 139: Table D-2. Approximate Standard Err
- Page 140 and 141: Table D-4. Approximate Standard Err
- Page 143: U.S. Department of the InteriorU.S.