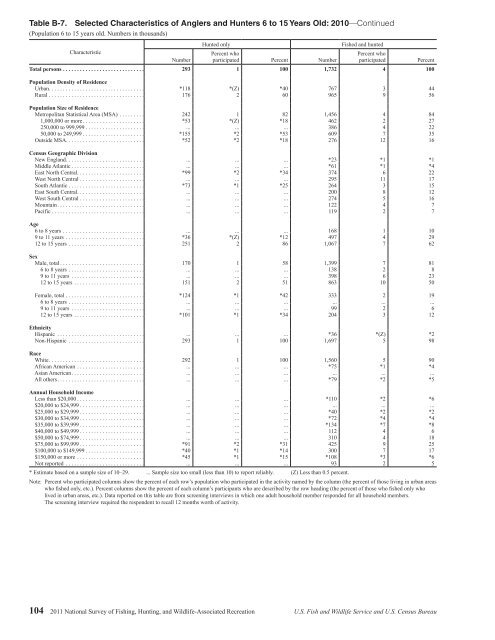
Table B-7. Selected Characteristics <strong>of</strong> Anglers <strong>and</strong> Hunters 6 to 15 Years Old: 2010—Continued(Population 6 to 15 years old. Numbers in thous<strong>and</strong>s)CharacteristicNumberHunted onlyPercent whoparticipated Percent NumberFished <strong>and</strong> huntedPercent whoparticipatedTotal persons ............................. 293 1 100 1,732 4 100Population Density <strong>of</strong> ResidenceUrban .................................. *118 *(Z) *40 767 3 44Rural .................................. 176 2 60 965 9 56Population Size <strong>of</strong> ResidenceMetropolitan Statistical Area (MSA) ......... 242 1 82 1,456 4 841,000,000 or more ...................... *53 *(Z) *18 462 2 27250,000 to 999,999 ..................... ... ... ... 386 4 2250,000 to 249,999 ...................... *155 *2 *53 609 7 35Outside MSA ............................ *52 *2 *18 276 12 16Census Geographic DivisionNew Engl<strong>and</strong> ............................ ... ... ... *23 *1 *1Middle Atlantic .......................... ... ... ... *61 *1 *4East North Central ........................ *99 *2 *34 374 6 22West North Central ....................... ... ... ... 295 11 17South Atlantic ........................... *73 *1 *25 264 3 15East South Central ........................ ... ... ... 200 8 12West South Central ....................... ... ... ... 274 5 16Mountain ............................... ... ... ... 122 4 7Pacific ................................. ... ... ... 119 2 7Age6 to 8 years ............................. ... ... ... 168 1 109 to 11 years ............................ *36 *(Z) *12 497 4 2912 to 15 years ........................... 251 2 86 1,067 7 62SexMale, total .............................. 170 1 58 1,399 7 816 to 8 years ........................... ... ... ... 138 2 89 to 11 years .......................... ... ... ... 398 6 2312 to 15 years ......................... 151 2 51 863 10 50Female, total ............................ *124 *1 *42 333 2 196 to 8 years ........................... ... ... ... ... ... ...9 to 11 years .......................... ... ... ... 99 2 612 to 15 years ......................... *101 *1 *34 204 3 12EthnicityHispanic ............................... ... ... ... *36 *(Z) *2Non-Hispanic ........................... 293 1 100 1,697 5 98RaceWhite .................................. 292 1 100 1,560 5 90African American ........................ ... ... ... *75 *1 *4Asian American .......................... ... ... ... ... ... ...<strong>All</strong> others ............................... ... ... ... *79 *2 *5Annual Household IncomeLess than $20,000 ........................ ... ... ... *110 *2 *6$20,000 to $24,999 ....................... ... ... ... ... ... ...$25,000 to $29,999 ....................... ... ... ... *40 *2 *2$30,000 to $34,999 ....................... ... ... ... *72 *4 *4$35,000 to $39,999 ....................... ... ... ... *134 *7 *8$40,000 to $49,999 ....................... ... ... ... 112 4 6$50,000 to $74,999 ....................... ... ... ... 310 4 18$75,000 to $99,999 ....................... *91 *2 *31 425 9 25$100,000 to $149,999 ..................... *40 *1 *14 300 7 17$150,000 or more ........................ *45 *1 *15 *108 *3 *6Not reported ............................ ... ... ... 93 2 5* Estimate based on a sample size <strong>of</strong> 10–29. ... Sample size too small (less than 10) to report reliably. (Z) Less than 0.5 percent.Note: Percent who participated columns show the percent <strong>of</strong> each row’s population who participated in the activity named by the column (the percent <strong>of</strong> those living in urban areaswho fished only, etc.). Percent columns show the percent <strong>of</strong> each column’s participants who are described by the row heading (the percent <strong>of</strong> those who fished only wholived in urban areas, etc.). Data reported on this table are from screening interviews in which one adult household member responded for all household members.The screening interview required the respondent to recall 12 months worth <strong>of</strong> activity.Percent104 2011 <strong>National</strong> <strong>Survey</strong> <strong>of</strong> <strong>Fishing</strong>, <strong>Hunting</strong>, <strong>and</strong> <strong>Wildlife</strong>-Associated Recreation U.S. Fish <strong>and</strong> <strong>Wildlife</strong> Service <strong>and</strong> U.S. Census Bureau
Table B-8. Selected Characteristics <strong>of</strong> <strong>Wildlife</strong>-Watching Participants 6 to 15 Years Old: 2010(Population 6 to 15 years old. Numbers in thous<strong>and</strong>s)CharacteristicU.S. populationNumber Percent NumberParticipantsTotal Away from home Around the homePercent whoparticipated Percent NumberPercent whoparticipated Percent NumberPercent whoparticipatedTotal persons ......................... 40,735 100 12,654 31 100 5,287 13 100 11,130 27 100Population Density <strong>of</strong> ResidenceUrban .............................. 30,138 74 8,458 28 67 3,682 12 70 7,294 24 66Rural .............................. 10,596 26 4,196 40 33 1,605 15 30 3,836 36 34Population Size <strong>of</strong> ResidenceMetropolitan Statistical Area (MSA) ..... 38,520 95 11,953 31 94 5,002 13 95 10,509 27 941,000,000 or more .................. 21,283 52 6,085 29 48 2,437 11 46 5,372 25 48250,000 to 999,999 ................. 8,804 22 2,856 32 23 1,223 14 23 2,431 28 2250,000 to 249,999 .................. 8,433 21 3,012 36 24 1,342 16 25 2,707 32 24Outside MSA ........................ 2,214 5 701 32 6 285 13 5 621 28 6Census Geographic DivisionNew Engl<strong>and</strong> ........................ 1,726 4 593 34 5 274 16 5 521 30 5Middle Atlantic ...................... 5,034 12 1,434 28 11 430 9 8 1,309 26 12East North Central .................... 6,072 15 2,204 36 17 904 15 17 2,004 33 18West North Central ................... 2,645 6 1,003 38 8 455 17 9 846 32 8South Atlantic ....................... 7,606 19 2,392 31 19 1,012 13 19 2,079 27 19East South Central .................... 2,407 6 590 24 5 299 12 6 565 23 5West South Central ................... 5,365 13 1,451 27 11 420 8 8 1,282 24 12Mountain ........................... 3,168 8 999 32 8 541 17 10 822 26 7Pacific ............................. 6,711 16 1,989 30 16 953 14 18 1,701 25 15Age6 to 8 years ......................... 11,866 29 3,356 28 27 1,492 13 28 2,947 25 269 to 11 years ........................ 12,488 31 4,688 38 37 1,793 14 34 4,182 33 3812 to 15 years ....................... 16,380 40 4,611 28 36 2,001 12 38 4,002 24 36SexMale, total .......................... 21,420 53 6,690 31 53 2,808 13 53 5,819 27 526 to 8 years ....................... 5,925 15 1,601 27 13 676 11 13 1,405 24 139 to 11 years ...................... 6,818 17 2,571 38 20 1,006 15 19 2,230 33 2012 to 15 years ..................... 8,678 21 2,518 29 20 1,126 13 21 2,184 25 20Female, total ........................ 19,315 47 5,964 31 47 2,479 13 47 5,312 28 486 to 8 years ....................... 5,942 15 1,755 30 14 816 14 15 1,542 26 149 to 11 years ...................... 5,670 14 2,117 37 17 787 14 15 1,952 34 1812 to 15 years ..................... 7,702 19 2,092 27 17 876 11 17 1,818 24 16EthnicityHispanic ........................... 7,846 19 1,430 18 11 510 6 10 1,278 16 11Non-Hispanic ....................... 32,889 81 11,224 34 89 4,777 15 90 9,852 30 89RaceWhite .............................. 28,458 70 10,346 36 82 4,226 15 80 9,178 32 82African American .................... 5,116 13 768 15 6 324 6 6 704 14 6Asian American ...................... 2,055 5 460 22 4 258 13 5 388 19 3<strong>All</strong> others ........................... 5,105 13 1,081 21 9 480 9 9 861 17 8Annual Household IncomeLess than $20,000 .................... 4,686 12 998 21 8 392 8 7 825 18 7$20,000 to $24,999 ................... 2,236 5 516 23 4 248 11 5 425 19 4$25,000 to $29,999 ................... 2,073 5 574 28 5 208 10 4 518 25 5$30,000 to $34,999 ................... 1,777 4 538 30 4 115 6 2 534 30 5$35,000 to $39,999 ................... 2,045 5 384 19 3 198 10 4 375 18 3$40,000 to $49,999 ................... 2,939 7 1,076 37 9 504 17 10 952 32 9$50,000 to $74,999 ................... 7,146 18 2,687 38 21 1,046 15 20 2,316 32 21$75,000 to $99,999 ................... 4,599 11 1,824 40 14 730 16 14 1,617 35 15$100,000 to $149,999 ................. 4,452 11 1,809 41 14 816 18 15 1,567 35 14$150,000 or more .................... 3,281 8 1,301 40 10 663 20 13 1,140 35 10Not reported ........................ 5,501 14 947 17 7 367 7 7 861 16 8Note: Percent who participated columns show the percent <strong>of</strong> each row’s population who participated in the activity named by the column (the percent <strong>of</strong> those living in urban areaswho fished only, etc.). Percent columns show the percent <strong>of</strong> each column’s participants who are described by the row heading (the percent <strong>of</strong> those who fished only wholived in urban areas, etc.). Data reported on this table are from screening interviews in which one adult household member responded for all household members.The screening interview required the respondent to recall 12 months worth <strong>of</strong> activity.PercentU.S. Fish <strong>and</strong> <strong>Wildlife</strong> Service <strong>and</strong> U.S. Census Bureau 2011 <strong>National</strong> <strong>Survey</strong> <strong>of</strong> <strong>Fishing</strong>, <strong>Hunting</strong>, <strong>and</strong> <strong>Wildlife</strong>-Associated Recreation 105
- Page 1:
U.S. Fish & Wildlife Service2011Nat
- Page 4 and 5:
Economics and StatisticsAdministrat
- Page 6 and 7:
List of TablesFishing and Hunting1.
- Page 8 and 9:
ForewordWhen I was growing up, it w
- Page 11 and 12:
Highlights
- Page 13 and 14:
watching (observing, photographing,
- Page 15 and 16:
Expenditures for Wildlife-Related R
- Page 17 and 18:
Fishing
- Page 19 and 20:
Fishing ExpendituresAnglers spent $
- Page 21 and 22:
Freshwater Fishing ExpendituresAngl
- Page 23 and 24:
pike, pickerel, and muskie, as well
- Page 25 and 26:
Sex and Age of AnglersAlthough more
- Page 27 and 28:
The majority of anglers had househo
- Page 29:
2001-2011 Fishing Participants, Day
- Page 32 and 33:
Hunting HighlightsIn 2011, 13.7 mil
- Page 34 and 35:
Big Game HuntingIn 2011, a majority
- Page 36 and 37:
Days per hunterTrips per hunterTrip
- Page 38 and 39:
Hunting on Public and PrivateLandsm
- Page 40 and 41:
Large MSA25%Medium MSA17%Percent of
- Page 42 and 43:
Hispanics, who represent a growingp
- Page 45 and 46:
Wildlife WatchingU.S. Fish and Wild
- Page 47 and 48:
Wildlife-Watching ExpendituresThirt
- Page 49 and 50:
Wildlife Fed, Observed, orPhotograp
- Page 51 and 52:
Metropolitan and NonmetropolitanAro
- Page 53 and 54:
Education, Race, and Ethnicity ofAr
- Page 55 and 56:
Away-From-Home Participantsby Type
- Page 57 and 58:
Away-From-Home WildlifeWatchers by
- Page 59 and 60:
Metropolitan and NonmetropolitanAwa
- Page 61 and 62:
2001-2011 Comparison of Wildlife-Wa
- Page 63: 2006-2011 Wildlife-Watching Partici
- Page 66 and 67: Guide to Statistical TablesPurpose
- Page 68 and 69: Table 3. Freshwater Anglers and Day
- Page 70 and 71: Table 7. Hunters and Days of Huntin
- Page 72 and 73: Table 8. Selected Characteristics o
- Page 74 and 75: Table 9. Selected Characteristics o
- Page 76 and 77: Table 10. Selected Characteristics
- Page 78 and 79: Table 12. Expenditures for Fishing:
- Page 80 and 81: Table 14. Trip and Equipment Expend
- Page 82 and 83: Table 16. Trip and Equipment Expend
- Page 84 and 85: Table 18. Trip and Equipment Expend
- Page 86 and 87: Table 20. Trip and Equipment Expend
- Page 88 and 89: Table 22. Special Equipment Expendi
- Page 90 and 91: Table 25. Freshwater Anglers and Da
- Page 92 and 93: Table 29. Hunters and Days of Hunti
- Page 94 and 95: Table 33. Hunters Preparing for Hun
- Page 96 and 97: Table 37. Participation in Wildlife
- Page 98 and 99: Table 40. Expenditures for Wildlife
- Page 100 and 101: Table 41. Selected Characteristics
- Page 102 and 103: Table 42. Selected Characteristics
- Page 104 and 105: Table 46. Total Wildlife-Related Pa
- Page 106 and 107: Appendix A.DefinitionsAnnual househ
- Page 108 and 109: State governments (such as State pa
- Page 110 and 111: Appendix B.2010 Participation of 6-
- Page 112 and 113: Table B-4. Most Recent Year of Fish
- Page 116 and 117: Table B-9. Participation by 6-to-15
- Page 118 and 119: Appendix C.Significant Methodologic
- Page 120 and 121: Table C-1. Major Characteristics of
- Page 122 and 123: Table C-2. Anglers and Hunters by C
- Page 124 and 125: household income in the 2001Survey.
- Page 126 and 127: Table C-4. Comparison of Major Find
- Page 128 and 129: Table C-5. Anglers and Hunters by C
- Page 130 and 131: Appendix D.Sample Design and Statis
- Page 132 and 133: lation 6 to 15 years of age were de
- Page 134 and 135: compute in advance the standard err
- Page 136 and 137: Illustration of the Computation of
- Page 138 and 139: Table D-2. Approximate Standard Err
- Page 140 and 141: Table D-4. Approximate Standard Err
- Page 143: U.S. Department of the InteriorU.S.