

National Survey of Fishing, Hunting, and Wildlife ... - All About Birds
National Survey of Fishing, Hunting, and Wildlife ... - All About Birds
National Survey of Fishing, Hunting, and Wildlife ... - All About Birds

Create successful ePaper yourself
Turn your PDF publications into a flip-book with our unique Google optimized e-Paper software.
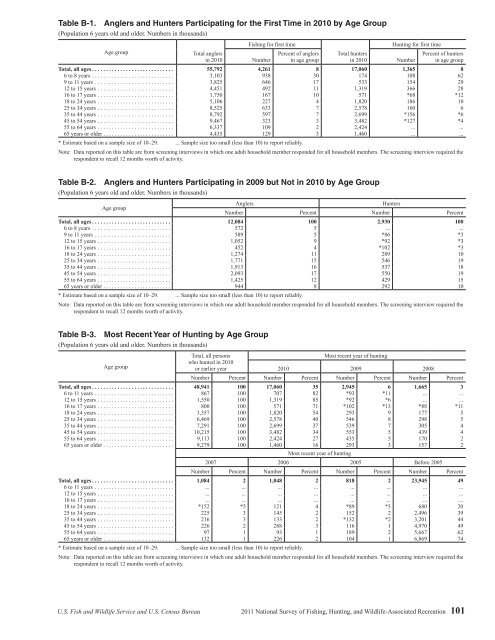
Table B-1. Anglers <strong>and</strong> Hunters Participating for the First Time in 2010 by Age Group(Population 6 years old <strong>and</strong> older. Numbers in thous<strong>and</strong>s)Age groupTotal anglersin 2010<strong>Fishing</strong> for first timeNumberPercent <strong>of</strong> anglersin age groupTotal huntersin 2010<strong>Hunting</strong> for first timeNumberPercent <strong>of</strong> huntersin age groupTotal, all ages ............................. 55,792 4,261 8 17,060 1,365 86 to 8 years ............................. 3,103 938 30 174 108 629 to 11 years ............................ 3,825 646 17 533 154 2912 to 15 years ........................... 4,451 492 11 1,319 366 2816 to 17 years ........................... 1,750 167 10 571 *68 *1218 to 24 years ........................... 5,106 227 4 1,820 186 1025 to 34 years ........................... 8,525 633 7 2,578 160 635 to 44 years ........................... 8,792 597 7 2,699 *156 *645 to 54 years ........................... 9,467 323 3 3,482 *127 *455 to 64 years ........................... 6,337 109 2 2,424 ... ...65 years or older ......................... 4,435 129 3 1,460 ... ...* Estimate based on a sample size <strong>of</strong> 10–29. ... Sample size too small (less than 10) to report reliably.Note: Data reported on this table are from screening interviews in which one adult household member responded for all household members. The screening interview required therespondent to recall 12 months worth <strong>of</strong> activity.Table B-2. Anglers <strong>and</strong> Hunters Participating in 2009 but Not in 2010 by Age Group(Population 6 years old <strong>and</strong> older. Numbers in thous<strong>and</strong>s)Age groupAnglersHuntersNumber Percent Number PercentTotal, all ages ............................ 12,084 100 2,930 1006 to 8 years ............................ 572 5 ... ...9 to 11 years ........................... 589 5 *86 *312 to 15 years .......................... 1,052 9 *92 *316 to 17 years .......................... 452 4 *102 *318 to 24 years .......................... 1,274 11 289 1025 to 34 years .......................... 1,771 15 546 1935 to 44 years .......................... 1,913 16 537 1845 to 54 years .......................... 2,093 17 550 1955 to 64 years .......................... 1,425 12 429 1565 years or older ........................ 944 8 292 10* Estimate based on a sample size <strong>of</strong> 10–29. ... Sample size too small (less than 10) to report reliably.Note: Data reported on this table are from screening interviews in which one adult household member responded for all household members. The screening interview required therespondent to recall 12 months worth <strong>of</strong> activity.Table B-3. Most Recent Year <strong>of</strong> <strong>Hunting</strong> by Age Group(Population 6 years old <strong>and</strong> older. Numbers in thous<strong>and</strong>s)Age groupTotal, all personswho hunted in 2010or earlier yearMost recent year <strong>of</strong> hunting2010 2009 2008Number Percent Number Percent Number Percent Number PercentTotal, all ages ............................. 48,941 100 17,060 35 2,945 6 1,665 36 to 11 years ............................ 867 100 707 82 *93 *11 ... ...12 to 15 years ........................... 1,550 100 1,319 85 *92 *6 ... ...16 to 17 years ........................... 800 100 571 71 *102 *13 *88 *1118 to 24 years ........................... 3,357 100 1,820 54 293 9 177 525 to 34 years ........................... 6,469 100 2,578 40 546 8 298 535 to 44 years ........................... 7,291 100 2,699 37 539 7 305 445 to 54 years ........................... 10,215 100 3,482 34 553 5 439 455 to 64 years ........................... 9,113 100 2,424 27 435 5 170 265 years or older ......................... 9,279 100 1,460 16 293 3 157 2Most recent year <strong>of</strong> hunting2007 2006 2005 Before 2005Number Percent Number Percent Number Percent Number PercentTotal, all ages ............................. 1,084 2 1,048 2 818 2 23,945 496 to 11 years ............................ ... ... ... ... ... ... ... ...12 to 15 years ........................... ... ... ... ... ... ... ... ...16 to 17 years ........................... ... ... ... ... ... ... ... ...18 to 24 years ........................... *152 *5 121 4 *89 *3 680 2025 to 34 years ........................... 225 3 145 2 152 2 2,496 3935 to 44 years ........................... 216 3 133 2 *132 *2 3,201 4445 to 54 years ........................... 226 2 288 3 116 1 4,970 4955 to 64 years ........................... 97 1 93 1 189 2 5,667 6265 years or older ......................... 132 1 226 2 104 1 6,869 74* Estimate based on a sample size <strong>of</strong> 10–29. ... Sample size too small (less than 10) to report reliably.Note: Data reported on this table are from screening interviews in which one adult household member responded for all household members. The screening interview required therespondent to recall 12 months worth <strong>of</strong> activity.U.S. Fish <strong>and</strong> <strong>Wildlife</strong> Service <strong>and</strong> U.S. Census Bureau 2011 <strong>National</strong> <strong>Survey</strong> <strong>of</strong> <strong>Fishing</strong>, <strong>Hunting</strong>, <strong>and</strong> <strong>Wildlife</strong>-Associated Recreation 101


