Appendix C.Significant Methodological Changes FromPrevious <strong>Survey</strong>s <strong>and</strong> Regional TrendsThe 2011 <strong>National</strong> <strong>Survey</strong> <strong>of</strong> <strong>Fishing</strong>,<strong>Hunting</strong>, <strong>and</strong> <strong>Wildlife</strong>-AssociatedRecreation (FHWAR) was designedto continue the data collection <strong>of</strong>the 1955 to 2006 <strong>Survey</strong>s. Whilecomplete comparability between anytwo <strong>Survey</strong>s cannot be achieved, thisappendix compares major findings <strong>of</strong>all the <strong>Survey</strong>s <strong>and</strong> presents trends forthe major categories <strong>of</strong> wildlife-relatedrecreation where feasible. Differencesamong the <strong>Survey</strong>s are discussed in thefollowing two sections.The principal characteristics <strong>of</strong> the1955 to 2011 <strong>Survey</strong>s are summarizedin Table C-1. The table shows the scope<strong>and</strong> design <strong>of</strong> all 12 <strong>Survey</strong>s.This appendix provides trend informationin two sections (1991 to 2011 <strong>and</strong>1955 to 1985). A significant changewas made in 1991 in the recall periodused in the detailed phase <strong>of</strong> theFHWAR <strong>Survey</strong>s. The recall periodin 1991 was shortened from the 12months used in previous <strong>Survey</strong>s to 4months in order to improve the accuracy<strong>of</strong> the data collected. As a result<strong>of</strong> that change, the <strong>Survey</strong>s conductedsince 1991 cannot be compared withthose conducted earlier.The 1955 to 1985 <strong>Survey</strong>s requiredrespondents to recall their recreationactivities for the survey year at thebeginning <strong>of</strong> the following year. The1991 to 2011 <strong>Survey</strong>s went to therespondents two or three times duringthe survey year to get their activityinformation. The change in the recallperiod was due to a study 1 <strong>of</strong> theeffect <strong>of</strong> the respondent recall length1Investigation <strong>of</strong> Possible Recall/Reference Period Biasin <strong>National</strong> <strong>Survey</strong>s <strong>of</strong> <strong>Fishing</strong>, <strong>Hunting</strong> <strong>and</strong> <strong>Wildlife</strong>-Associated Recreation, December 1989, Westat, Inc.on survey estimates. The study foundsignificant differences in FHWAR<strong>Survey</strong> results using annual recallperiods versus shorter recall periods.Longer recall periods lead to higherestimates. Even when everything elsewas held constant, such as questionnairecontent <strong>and</strong> sample design,increasing the respondent’s recallperiod resulted in significantly higherestimates for the same phenomenon.The recall study also found that theextent <strong>of</strong> recall bias varied for differenttypes <strong>of</strong> fishing <strong>and</strong> hunting participation<strong>and</strong> expenditures. For example,annual recall respondents gave anestimate <strong>of</strong> average annual days <strong>of</strong> saltwaterfishing that was 46 percent higherthan the trimester recall estimate, whilethe annual recall estimate <strong>of</strong> averageannual saltwater fishing trips was 30percent higher than the trimester recallestimate. This means there is no singlecorrection factor for all survey estimateswhen calculating trends from<strong>Survey</strong>s using different recall periods.Reliable trends analysis needs to usedata compiled from surveys in whichthe important elements, such as thesample design <strong>and</strong> recall period, are notsignificantly different.1991 to 2011 SignificantMethodological DifferencesThe most significant design differencesin the five <strong>Survey</strong>s are as follows:1. The 1991 <strong>Survey</strong> data wascollected by interviewers fillingout paper questionnaires. The dataentries were keyed in a separateoperation after the interview. The1996, 2001, 2006, <strong>and</strong> 2011 <strong>Survey</strong>data were collected by the use <strong>of</strong>computer-assisted interviews. Thequestionnaires were programmedinto computers, <strong>and</strong> the interviewerkeyed in the responses at the time<strong>of</strong> the interview.2. The 1991 <strong>Survey</strong> screeningphase was conducted in January<strong>and</strong> February <strong>of</strong> 1991, when ahousehold member <strong>of</strong> the samplehouseholds was interviewed onbehalf <strong>of</strong> the entire household.The screening interviews for the1996, 2001, <strong>and</strong> 2006 <strong>Survey</strong>s wereconducted April through June <strong>of</strong>their survey years in conjunctionwith the first wave <strong>of</strong> the detailedinterviews. The 2011 <strong>Survey</strong> alsoconducted screening interviews <strong>and</strong>the first detailed interviews Aprilthrough June <strong>of</strong> 2011, but furthermorehad an additional screening<strong>and</strong> detailed effort from February2012 to the end <strong>of</strong> May 2012. TheApril–June 2011 screening efforthad a high noncontact rate because<strong>of</strong> poor results using sample telephonenumbers obtained from aprivate firm. Census went back tothe noncontacted component <strong>of</strong> theoriginal sample in February-May2012 <strong>and</strong> interviewed a subsample,requiring annual recall for thoserespondents. The Wave 3 screensample was 12,484 <strong>of</strong> the total48,600 household screen sample. Amodification <strong>of</strong> the 2011 samplingscheme was to oversample countiesthat had relatively high proportions<strong>of</strong> hunting license purchases.The screening interviews for all five<strong>Survey</strong>s consisted primarily <strong>of</strong> demographicquestions <strong>and</strong> wildlife-relatedrecreation questions concerning activityin the previous year (1990, 1995, etc.)<strong>and</strong> intentions for recreating in thesurvey year.108 2011 <strong>National</strong> <strong>Survey</strong> <strong>of</strong> <strong>Fishing</strong>, <strong>Hunting</strong>, <strong>and</strong> <strong>Wildlife</strong>-Associated Recreation U.S. Fish <strong>and</strong> <strong>Wildlife</strong> Service <strong>and</strong> U.S. Census Bureau
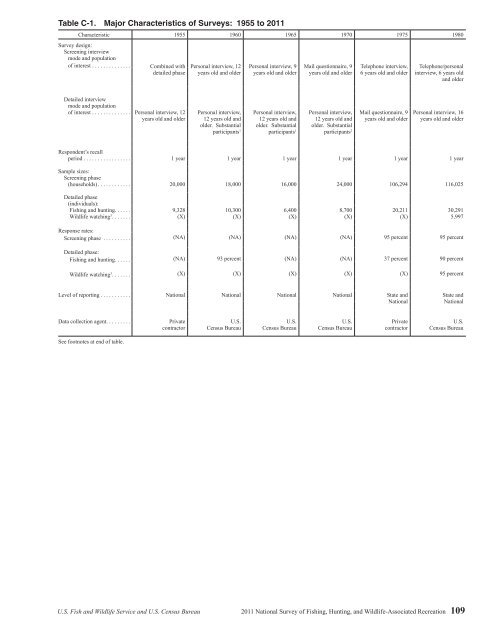
Table C-1. Major Characteristics <strong>of</strong> <strong>Survey</strong>s: 1955 to 2011Characteristic 1955 1960 1965 1970 1975 1980<strong>Survey</strong> design:Screening interviewmode <strong>and</strong> population<strong>of</strong> interest ..............Combined withdetailed phasePersonal interview, 12years old <strong>and</strong> olderPersonal interview, 9years old <strong>and</strong> olderMail questionnaire, 9years old <strong>and</strong> olderTelephone interview,6 years old <strong>and</strong> olderTelephone/personalinterview, 6 years old<strong>and</strong> olderDetailed interviewmode <strong>and</strong> population<strong>of</strong> interest .............. Personal interview, 12years old <strong>and</strong> olderPersonal interview,12 years old <strong>and</strong>older. Substantialparticipants 1Personal interview,12 years old <strong>and</strong>older. Substantialparticipants 1Personal interview, Mail questionnaire, 912 years old <strong>and</strong> years old <strong>and</strong> olderolder. Substantialparticipants 2Personal interview, 16years old <strong>and</strong> olderRespondent’s recallperiod ................. 1 year 1 year 1 year 1 year 1 year 1 yearSample sizes:Screening phase(households)............ 20,000 18,000 16,000 24,000 106,294 116,025Detailed phase(individuals):<strong>Fishing</strong> <strong>and</strong> hunting. . . . . . 9,328 10,300 6,400 8,700 20,211 30,291<strong>Wildlife</strong> watching 3 ....... (X) (X) (X) (X) (X) 5,997Response rates:Screening phase .......... (NA) (NA) (NA) (NA) 95 percent 95 percentDetailed phase:<strong>Fishing</strong> <strong>and</strong> hunting. . . . . . (NA) 93 percent (NA) (NA) 37 percent 90 percent<strong>Wildlife</strong> watching 3 ....... (X) (X) (X) (X) (X) 95 percentLevel <strong>of</strong> reporting ........... <strong>National</strong> <strong>National</strong> <strong>National</strong> <strong>National</strong> State <strong>and</strong><strong>National</strong>State <strong>and</strong><strong>National</strong>Data collection agent .........PrivatecontractorU.S.Census BureauU.S.Census BureauU.S.Census BureauPrivatecontractorU.S.Census BureauSee footnotes at end <strong>of</strong> table.U.S. Fish <strong>and</strong> <strong>Wildlife</strong> Service <strong>and</strong> U.S. Census Bureau 2011 <strong>National</strong> <strong>Survey</strong> <strong>of</strong> <strong>Fishing</strong>, <strong>Hunting</strong>, <strong>and</strong> <strong>Wildlife</strong>-Associated Recreation 109
- Page 1:
U.S. Fish & Wildlife Service2011Nat
- Page 4 and 5:
Economics and StatisticsAdministrat
- Page 6 and 7:
List of TablesFishing and Hunting1.
- Page 8 and 9:
ForewordWhen I was growing up, it w
- Page 11 and 12:
Highlights
- Page 13 and 14:
watching (observing, photographing,
- Page 15 and 16:
Expenditures for Wildlife-Related R
- Page 17 and 18:
Fishing
- Page 19 and 20:
Fishing ExpendituresAnglers spent $
- Page 21 and 22:
Freshwater Fishing ExpendituresAngl
- Page 23 and 24:
pike, pickerel, and muskie, as well
- Page 25 and 26:
Sex and Age of AnglersAlthough more
- Page 27 and 28:
The majority of anglers had househo
- Page 29:
2001-2011 Fishing Participants, Day
- Page 32 and 33:
Hunting HighlightsIn 2011, 13.7 mil
- Page 34 and 35:
Big Game HuntingIn 2011, a majority
- Page 36 and 37:
Days per hunterTrips per hunterTrip
- Page 38 and 39:
Hunting on Public and PrivateLandsm
- Page 40 and 41:
Large MSA25%Medium MSA17%Percent of
- Page 42 and 43:
Hispanics, who represent a growingp
- Page 45 and 46:
Wildlife WatchingU.S. Fish and Wild
- Page 47 and 48:
Wildlife-Watching ExpendituresThirt
- Page 49 and 50:
Wildlife Fed, Observed, orPhotograp
- Page 51 and 52:
Metropolitan and NonmetropolitanAro
- Page 53 and 54:
Education, Race, and Ethnicity ofAr
- Page 55 and 56:
Away-From-Home Participantsby Type
- Page 57 and 58:
Away-From-Home WildlifeWatchers by
- Page 59 and 60:
Metropolitan and NonmetropolitanAwa
- Page 61 and 62:
2001-2011 Comparison of Wildlife-Wa
- Page 63:
2006-2011 Wildlife-Watching Partici
- Page 66 and 67:
Guide to Statistical TablesPurpose
- Page 68 and 69: Table 3. Freshwater Anglers and Day
- Page 70 and 71: Table 7. Hunters and Days of Huntin
- Page 72 and 73: Table 8. Selected Characteristics o
- Page 74 and 75: Table 9. Selected Characteristics o
- Page 76 and 77: Table 10. Selected Characteristics
- Page 78 and 79: Table 12. Expenditures for Fishing:
- Page 80 and 81: Table 14. Trip and Equipment Expend
- Page 82 and 83: Table 16. Trip and Equipment Expend
- Page 84 and 85: Table 18. Trip and Equipment Expend
- Page 86 and 87: Table 20. Trip and Equipment Expend
- Page 88 and 89: Table 22. Special Equipment Expendi
- Page 90 and 91: Table 25. Freshwater Anglers and Da
- Page 92 and 93: Table 29. Hunters and Days of Hunti
- Page 94 and 95: Table 33. Hunters Preparing for Hun
- Page 96 and 97: Table 37. Participation in Wildlife
- Page 98 and 99: Table 40. Expenditures for Wildlife
- Page 100 and 101: Table 41. Selected Characteristics
- Page 102 and 103: Table 42. Selected Characteristics
- Page 104 and 105: Table 46. Total Wildlife-Related Pa
- Page 106 and 107: Appendix A.DefinitionsAnnual househ
- Page 108 and 109: State governments (such as State pa
- Page 110 and 111: Appendix B.2010 Participation of 6-
- Page 112 and 113: Table B-4. Most Recent Year of Fish
- Page 114 and 115: Table B-7. Selected Characteristics
- Page 116 and 117: Table B-9. Participation by 6-to-15
- Page 120 and 121: Table C-1. Major Characteristics of
- Page 122 and 123: Table C-2. Anglers and Hunters by C
- Page 124 and 125: household income in the 2001Survey.
- Page 126 and 127: Table C-4. Comparison of Major Find
- Page 128 and 129: Table C-5. Anglers and Hunters by C
- Page 130 and 131: Appendix D.Sample Design and Statis
- Page 132 and 133: lation 6 to 15 years of age were de
- Page 134 and 135: compute in advance the standard err
- Page 136 and 137: Illustration of the Computation of
- Page 138 and 139: Table D-2. Approximate Standard Err
- Page 140 and 141: Table D-4. Approximate Standard Err
- Page 143: U.S. Department of the InteriorU.S.