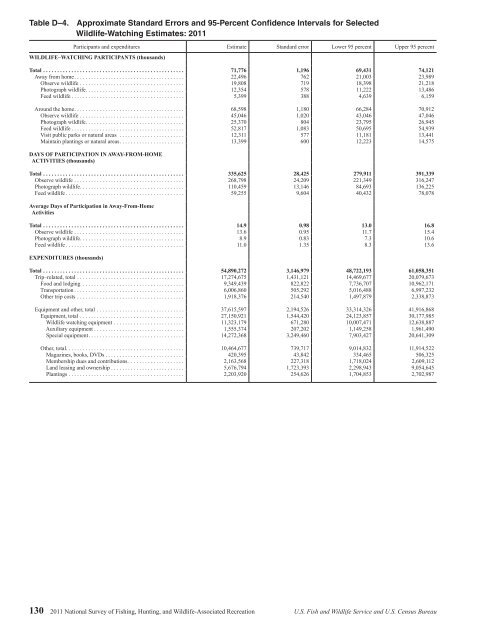
Table D–4. Approximate St<strong>and</strong>ard Errors <strong>and</strong> 95-Percent Confidence Intervals for Selected<strong>Wildlife</strong>-Watching Estimates: 2011Participants <strong>and</strong> expenditures Estimate St<strong>and</strong>ard error Lower 95 percent Upper 95 percentWILDLIFE–WATCHING PARTICIPANTS (thous<strong>and</strong>s)Total .................................................. 71,776 1,196 69,431 74,121Away from home ...................................... . 22,496 762 21,003 23,989Observe wildlife ..................................... 19,808 719 18,398 21,218Photograph wildlife ................................... 12,354 578 11,222 13,486Feed wildlife ....................................... . 5,399 388 4,639 6,159Around the home ....................................... 68,598 1,180 66,284 70,912Observe wildlife ..................................... 45,046 1,020 43,046 47,046Photograph wildlife ................................... 25,370 804 23,795 26,945Feed wildlife ....................................... . 52,817 1,083 50,695 54,939Visit public parks or natural areas ....................... 12,311 577 11,181 13,441Maintain plantings or natural areas ....................... 13,399 600 12,223 14,575DAYS OF PARTICIPATION IN AWAY-FROM-HOMEACTIVITIES (thous<strong>and</strong>s)Total .................................................. 335,625 28,425 279,911 391,339Observe wildlife ....................................... 268,798 24,209 221,349 316,247Photograph wildlife ..................................... 110,459 13,146 84,693 136,225Feed wildlife ......................................... . 59,255 9,604 40,432 78,078Average Days <strong>of</strong> Participation in Away-From-HomeActivitiesTotal .................................................. 14.9 0.98 13.0 16.8Observe wildlife ....................................... 13.6 0.95 11.7 15.4Photograph wildlife ..................................... 8.9 0.83 7.3 10.6Feed wildlife ......................................... . 11.0 1.35 8.3 13.6EXPENDITURES (thous<strong>and</strong>s)Total .................................................. 54,890,272 3,146,979 48,722,193 61,058,351Trip–related, total .................................... . . 17,274,675 1,431,121 14,469,677 20,079,673Food <strong>and</strong> lodging .................................... 9,349,439 822,822 7,736,707 10,962,171Transportation ....................................... 6,006,860 505,292 5,016,488 6,997,232Other trip costs ...................................... 1,918,376 214,540 1,497,879 2,338,873Equipment <strong>and</strong> other, total .............................. . 37,615,597 2,194,526 33,314,326 41,916,868Equipment, total ..................................... 27,150,921 1,544,420 24,123,857 30,177,985<strong>Wildlife</strong> watching equipment ......................... 11,323,179 671,280 10,007,471 12,638,887Auxiliary equipment .............................. . . 1,555,374 207,202 1,149,258 1,961,490Special equipment .................................. 14,272,368 3,249,460 7,903,427 20,641,309Other, total. . . . . . . . . . . . . . . . . . . . . . . . . . . . . . . . . . . . . . . . . . 10,464,677 739,717 9,014,832 11,914,522Magazines, books, DVDs ............................ 420,395 43,842 334,465 506,325Membership dues <strong>and</strong> contributions .................... 2,163,568 227,318 1,718,024 2,609,112L<strong>and</strong> leasing <strong>and</strong> ownership .......................... 5,676,794 1,723,393 2,298,943 9,054,645Plantings ......................................... 2,203,920 254,626 1,704,853 2,702,987130 2011 <strong>National</strong> <strong>Survey</strong> <strong>of</strong> <strong>Fishing</strong>, <strong>Hunting</strong>, <strong>and</strong> <strong>Wildlife</strong>-Associated Recreation U.S. Fish <strong>and</strong> <strong>Wildlife</strong> Service <strong>and</strong> U.S. Census Bureau
Table D-5. Parameters a, b, <strong>and</strong> c for Calculating Approximate St<strong>and</strong>ard Errors for United StatesScreener Sample, Detailed Sportsperson Sample, <strong>and</strong> <strong>Wildlife</strong>-Watching Sample for Levels,Expenditures, <strong>and</strong> Days or TripsSampleParametersa b cScreener SampleSportspersons, anglers, hunters, <strong>and</strong> wildlife-watching participants—6 years old <strong>and</strong> older ............... –0.000043 12,272 –Sportspersons, anglers, hunters, <strong>and</strong> wildlife-watching participants—6 to 15 years old ................... –0.000387 15,783 –Detailed Sportperson SampleSportspersons <strong>and</strong> anglers 16 years old <strong>and</strong> older ................................................ –0.000070 16,823 –Hunters 16 years old <strong>and</strong> older ............................................................... –0.000066 15,798 –Expenditures for sportspersons <strong>and</strong> anglers 16 years old <strong>and</strong> older ................................... 0.001159 –575,615 45,670Expenditures for hunters 16 years old <strong>and</strong> older ................................................. 0.001923 –978,460 44,416Days or trips for sportspersons <strong>and</strong> anglers 16 years old <strong>and</strong> older ................................... 0.000068 –160,414 51,951Days or trips for hunters 16 years old <strong>and</strong> older .................................................. –0.000284 –127,863 46,699<strong>Wildlife</strong>-Watching SampleLevels <strong>of</strong> wildlife-watching—away-from-home participants ........................................ –0.000134 32,078 –Levels <strong>of</strong> wildlife-watching—wildlife-watching participants 1 ....................................... –0.000119 28,477 –Expenditures for wildlife-watching ........................................................... 0.001308 –1,548,024 112,362Days or trips for wildlife-watching ............................................................ 0.002307 826,023 54,1001Use these parameters for total wildlife-watching participants <strong>and</strong> around-the-home participants.U.S. Fish <strong>and</strong> <strong>Wildlife</strong> Service <strong>and</strong> U.S. Census Bureau 2011 <strong>National</strong> <strong>Survey</strong> <strong>of</strong> <strong>Fishing</strong>, <strong>Hunting</strong>, <strong>and</strong> <strong>Wildlife</strong>-Associated Recreation 131
- Page 1:
U.S. Fish & Wildlife Service2011Nat
- Page 4 and 5:
Economics and StatisticsAdministrat
- Page 6 and 7:
List of TablesFishing and Hunting1.
- Page 8 and 9:
ForewordWhen I was growing up, it w
- Page 11 and 12:
Highlights
- Page 13 and 14:
watching (observing, photographing,
- Page 15 and 16:
Expenditures for Wildlife-Related R
- Page 17 and 18:
Fishing
- Page 19 and 20:
Fishing ExpendituresAnglers spent $
- Page 21 and 22:
Freshwater Fishing ExpendituresAngl
- Page 23 and 24:
pike, pickerel, and muskie, as well
- Page 25 and 26:
Sex and Age of AnglersAlthough more
- Page 27 and 28:
The majority of anglers had househo
- Page 29:
2001-2011 Fishing Participants, Day
- Page 32 and 33:
Hunting HighlightsIn 2011, 13.7 mil
- Page 34 and 35:
Big Game HuntingIn 2011, a majority
- Page 36 and 37:
Days per hunterTrips per hunterTrip
- Page 38 and 39:
Hunting on Public and PrivateLandsm
- Page 40 and 41:
Large MSA25%Medium MSA17%Percent of
- Page 42 and 43:
Hispanics, who represent a growingp
- Page 45 and 46:
Wildlife WatchingU.S. Fish and Wild
- Page 47 and 48:
Wildlife-Watching ExpendituresThirt
- Page 49 and 50:
Wildlife Fed, Observed, orPhotograp
- Page 51 and 52:
Metropolitan and NonmetropolitanAro
- Page 53 and 54:
Education, Race, and Ethnicity ofAr
- Page 55 and 56:
Away-From-Home Participantsby Type
- Page 57 and 58:
Away-From-Home WildlifeWatchers by
- Page 59 and 60:
Metropolitan and NonmetropolitanAwa
- Page 61 and 62:
2001-2011 Comparison of Wildlife-Wa
- Page 63:
2006-2011 Wildlife-Watching Partici
- Page 66 and 67:
Guide to Statistical TablesPurpose
- Page 68 and 69:
Table 3. Freshwater Anglers and Day
- Page 70 and 71:
Table 7. Hunters and Days of Huntin
- Page 72 and 73:
Table 8. Selected Characteristics o
- Page 74 and 75:
Table 9. Selected Characteristics o
- Page 76 and 77:
Table 10. Selected Characteristics
- Page 78 and 79:
Table 12. Expenditures for Fishing:
- Page 80 and 81:
Table 14. Trip and Equipment Expend
- Page 82 and 83:
Table 16. Trip and Equipment Expend
- Page 84 and 85:
Table 18. Trip and Equipment Expend
- Page 86 and 87:
Table 20. Trip and Equipment Expend
- Page 88 and 89:
Table 22. Special Equipment Expendi
- Page 90 and 91: Table 25. Freshwater Anglers and Da
- Page 92 and 93: Table 29. Hunters and Days of Hunti
- Page 94 and 95: Table 33. Hunters Preparing for Hun
- Page 96 and 97: Table 37. Participation in Wildlife
- Page 98 and 99: Table 40. Expenditures for Wildlife
- Page 100 and 101: Table 41. Selected Characteristics
- Page 102 and 103: Table 42. Selected Characteristics
- Page 104 and 105: Table 46. Total Wildlife-Related Pa
- Page 106 and 107: Appendix A.DefinitionsAnnual househ
- Page 108 and 109: State governments (such as State pa
- Page 110 and 111: Appendix B.2010 Participation of 6-
- Page 112 and 113: Table B-4. Most Recent Year of Fish
- Page 114 and 115: Table B-7. Selected Characteristics
- Page 116 and 117: Table B-9. Participation by 6-to-15
- Page 118 and 119: Appendix C.Significant Methodologic
- Page 120 and 121: Table C-1. Major Characteristics of
- Page 122 and 123: Table C-2. Anglers and Hunters by C
- Page 124 and 125: household income in the 2001Survey.
- Page 126 and 127: Table C-4. Comparison of Major Find
- Page 128 and 129: Table C-5. Anglers and Hunters by C
- Page 130 and 131: Appendix D.Sample Design and Statis
- Page 132 and 133: lation 6 to 15 years of age were de
- Page 134 and 135: compute in advance the standard err
- Page 136 and 137: Illustration of the Computation of
- Page 138 and 139: Table D-2. Approximate Standard Err
- Page 143: U.S. Department of the InteriorU.S.