Table B-4. Most Recent Year <strong>of</strong> <strong>Fishing</strong> by Age Group(Population 6 years old <strong>and</strong> older. Numbers in thous<strong>and</strong>s)Age groupTotal, all personswho fished in 2010or earlier yearMost recent year <strong>of</strong> fishing2010 2009 2008Number Percent Number Percent Number Percent Number PercentTotal, all ages ............................. 126,710 100 55,804 44 12,224 10 5,925 56 to 11 years ............................ 9,021 100 6,928 77 1,163 13 372 412 to 15 years ........................... 7,327 100 4,451 61 1,052 14 553 816 to 17 years ........................... 3,082 100 1,750 57 457 15 194 618 to 24 years ........................... 10,982 100 5,106 46 1,327 12 737 725 to 34 years ........................... 18,236 100 8,525 47 1,793 10 955 535 to 44 years ........................... 18,799 100 8,793 47 1,923 10 764 445 to 54 years ........................... 22,840 100 9,467 41 2,121 9 1,102 555 to 64 years ........................... 19,247 100 6,346 33 1,441 7 705 465 years or older ......................... 17,177 100 4,438 26 947 6 542 3Most recent year <strong>of</strong> fishing2007 2006 2005 Before 2005Number Percent Number Percent Number Percent Number PercentTotal, all ages ............................. 3,672 3 4,174 3 2,557 2 40,869 326 to 11 years ............................ 159 2 *157 *2 *37 *(Z) 188 212 to 15 years ........................... 140 2 446 6 174 2 475 616 to 17 years ........................... 136 4 *97 *3 115 4 300 1018 to 24 years ........................... 483 4 628 6 254 2 2,104 1925 to 34 years ........................... 704 4 678 4 422 2 4,769 2635 to 44 years ........................... 575 3 645 3 398 2 5,521 2945 to 54 years ........................... 700 3 655 3 521 2 8,077 3555 to 64 years ........................... 412 2 420 2 375 2 9,401 4965 years or older ......................... 362 2 448 3 263 2 10,036 58* Estimate based on a sample size <strong>of</strong> 10–29. (Z) Less than 0.5 percent.Note: Data reported on this table are from screening interviews in which one adult household member responded for all household members. The screening interview required therespondent to recall 12 months worth <strong>of</strong> activity.Table B-5. Anglers <strong>and</strong> Hunters 6 to 15 Years Old: 2010(Population 6 to 15 years old. Numbers in thous<strong>and</strong>s)SportspersonsTotal, 6 to 15 years old 12 to 15 years old 9 to 11 years old 6 to 8 years oldNumber Percent Number Percent Number Percent Number PercentTotal sportspersons, fished or hunted ......... 11,673 100 4,702 100 3,861 100 3,109 100Total anglers ........................... 11,379 97 4,451 95 3,825 99 3,103 100Fished only ........................... 9,647 83 3,384 72 3,328 86 2,935 94Fished <strong>and</strong> hunted ...................... 1,732 15 1,067 23 497 13 168 5Total hunters ........................... 2,026 17 1,319 28 533 14 174 6Hunted only ........................... 293 3 251 5 *36 *1 ... ...Hunted <strong>and</strong> fished ...................... 1,732 15 1,067 23 497 13 168 5* Estimate based on a sample size <strong>of</strong> 10–29. ... Sample size too small (less than 10) to report reliably.Note: Detail does not add to total because <strong>of</strong> multiple responses. Data reported on this table are from screening interviews in which one adult household member responded for allhousehold members 6 to 15 years old. The screening interview required the respondent to recall 12 months worth <strong>of</strong> activity. Includes persons who fished or hunted only inother countries.Table B-6. <strong>Wildlife</strong>-Watching Participants 6 to 15 Years Old by <strong>Wildlife</strong>-Watching Activity: 2010(Population 6 to 15 years old. Numbers in thous<strong>and</strong>s)ActivityNumberTotal, 6 to 15 years old 12 to 15 years old 9 to 11 years old 6 to 8 years oldPercent <strong>of</strong>participantsPercent <strong>of</strong>population NumberPercent <strong>of</strong>participantsPercent <strong>of</strong>population NumberPercent <strong>of</strong>participantsPercent <strong>of</strong>population NumberPercent <strong>of</strong>participantsPercent <strong>of</strong>populationTotal participants ............ 12,654 100 31 4,611 100 28 4,688 100 38 3,356 100 28Away from home ............ 5,287 42 13 2,001 43 12 1,793 38 14 1,492 44 13Around the home ............ 11,130 88 27 4,002 87 24 4,182 89 33 2,947 88 25Observe wildlife .......... 9,621 76 24 3,310 72 20 3,741 80 30 2,571 77 22Photograph wildlife ........ 2,246 18 6 846 18 5 954 20 8 446 13 4Feed wild birds or otherwildlife ................ 4,436 35 11 1,412 31 9 1,744 37 14 1,279 38 11Maintain plantings or naturalareas .................. 1,718 14 4 517 11 3 813 17 7 389 12 3Note: Detail does not add to total because <strong>of</strong> multiple responses. Columns showing percent <strong>of</strong> participants are based on the first row <strong>of</strong> each column. Columns showingpercent <strong>of</strong> population in age group are based on the U.S. population in each age category, including those who did not participate in wildlife-watching activities. Datareported on this table are from screening interviews in which one adult household member responded for all household members 6 to 15 years old. The screening interviewrequired the respondent to recall 12 months worth <strong>of</strong> activity. Includes persons who participated only in other countries.102 2011 <strong>National</strong> <strong>Survey</strong> <strong>of</strong> <strong>Fishing</strong>, <strong>Hunting</strong>, <strong>and</strong> <strong>Wildlife</strong>-Associated Recreation U.S. Fish <strong>and</strong> <strong>Wildlife</strong> Service <strong>and</strong> U.S. Census Bureau
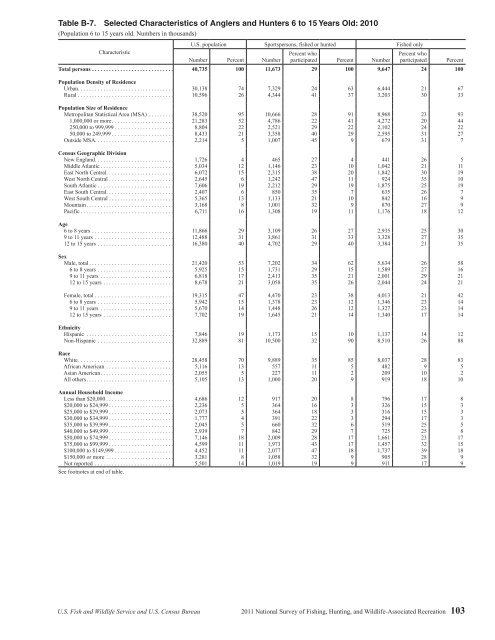
Table B-7. Selected Characteristics <strong>of</strong> Anglers <strong>and</strong> Hunters 6 to 15 Years Old: 2010(Population 6 to 15 years old. Numbers in thous<strong>and</strong>s)CharacteristicU.S. population Sportspersons, fished or hunted Fished onlyNumber Percent NumberPercent whoparticipated Percent NumberPercent whoparticipatedTotal persons ............................. 40,735 100 11,673 29 100 9,647 24 100Population Density <strong>of</strong> ResidenceUrban .................................. 30,138 74 7,329 24 63 6,444 21 67Rural .................................. 10,596 26 4,344 41 37 3,203 30 33Population Size <strong>of</strong> ResidenceMetropolitan Statistical Area (MSA) ......... 38,520 95 10,666 28 91 8,968 23 931,000,000 or more ...................... 21,283 52 4,786 22 41 4,272 20 44250,000 to 999,999 ..................... 8,804 22 2,521 29 22 2,102 24 2250,000 to 249,999 ...................... 8,433 21 3,358 40 29 2,595 31 27Outside MSA ............................ 2,214 5 1,007 45 9 679 31 7Census Geographic DivisionNew Engl<strong>and</strong> ............................ 1,726 4 465 27 4 441 26 5Middle Atlantic .......................... 5,034 12 1,146 23 10 1,042 21 11East North Central ........................ 6,072 15 2,315 38 20 1,842 30 19West North Central ....................... 2,645 6 1,242 47 11 924 35 10South Atlantic ........................... 7,606 19 2,212 29 19 1,875 25 19East South Central ........................ 2,407 6 850 35 7 635 26 7West South Central ....................... 5,365 13 1,133 21 10 842 16 9Mountain ............................... 3,168 8 1,001 32 9 870 27 9Pacific ................................. 6,711 16 1,308 19 11 1,176 18 12Age6 to 8 years ............................. 11,866 29 3,109 26 27 2,935 25 309 to 11 years ............................ 12,488 31 3,861 31 33 3,328 27 3512 to 15 years ........................... 16,380 40 4,702 29 40 3,384 21 35SexMale, total .............................. 21,420 53 7,202 34 62 5,634 26 586 to 8 years ........................... 5,925 15 1,731 29 15 1,589 27 169 to 11 years .......................... 6,818 17 2,413 35 21 2,001 29 2112 to 15 years ......................... 8,678 21 3,058 35 26 2,044 24 21Female, total ............................ 19,315 47 4,470 23 38 4,013 21 426 to 8 years ........................... 5,942 15 1,378 23 12 1,346 23 149 to 11 years .......................... 5,670 14 1,448 26 12 1,327 23 1412 to 15 years ......................... 7,702 19 1,645 21 14 1,340 17 14EthnicityHispanic ............................... 7,846 19 1,173 15 10 1,137 14 12Non-Hispanic ........................... 32,889 81 10,500 32 90 8,510 26 88RaceWhite .................................. 28,458 70 9,889 35 85 8,037 28 83African American ........................ 5,116 13 557 11 5 482 9 5Asian American .......................... 2,055 5 227 11 2 209 10 2<strong>All</strong> others ............................... 5,105 13 1,000 20 9 919 18 10Annual Household IncomeLess than $20,000 ........................ 4,686 12 917 20 8 796 17 8$20,000 to $24,999 ....................... 2,236 5 364 16 3 326 15 3$25,000 to $29,999 ....................... 2,073 5 364 18 3 316 15 3$30,000 to $34,999 ....................... 1,777 4 391 22 3 294 17 3$35,000 to $39,999 ....................... 2,045 5 660 32 6 519 25 5$40,000 to $49,999 ....................... 2,939 7 842 29 7 725 25 8$50,000 to $74,999 ....................... 7,146 18 2,009 28 17 1,661 23 17$75,000 to $99,999 ....................... 4,599 11 1,973 43 17 1,457 32 15$100,000 to $149,999 ..................... 4,452 11 2,077 47 18 1,737 39 18$150,000 or more ........................ 3,281 8 1,058 32 9 905 28 9Not reported ............................ 5,501 14 1,019 19 9 911 17 9See footnotes at end <strong>of</strong> table.PercentU.S. Fish <strong>and</strong> <strong>Wildlife</strong> Service <strong>and</strong> U.S. Census Bureau 2011 <strong>National</strong> <strong>Survey</strong> <strong>of</strong> <strong>Fishing</strong>, <strong>Hunting</strong>, <strong>and</strong> <strong>Wildlife</strong>-Associated Recreation 103
- Page 1:
U.S. Fish & Wildlife Service2011Nat
- Page 4 and 5:
Economics and StatisticsAdministrat
- Page 6 and 7:
List of TablesFishing and Hunting1.
- Page 8 and 9:
ForewordWhen I was growing up, it w
- Page 11 and 12:
Highlights
- Page 13 and 14:
watching (observing, photographing,
- Page 15 and 16:
Expenditures for Wildlife-Related R
- Page 17 and 18:
Fishing
- Page 19 and 20:
Fishing ExpendituresAnglers spent $
- Page 21 and 22:
Freshwater Fishing ExpendituresAngl
- Page 23 and 24:
pike, pickerel, and muskie, as well
- Page 25 and 26:
Sex and Age of AnglersAlthough more
- Page 27 and 28:
The majority of anglers had househo
- Page 29:
2001-2011 Fishing Participants, Day
- Page 32 and 33:
Hunting HighlightsIn 2011, 13.7 mil
- Page 34 and 35:
Big Game HuntingIn 2011, a majority
- Page 36 and 37:
Days per hunterTrips per hunterTrip
- Page 38 and 39:
Hunting on Public and PrivateLandsm
- Page 40 and 41:
Large MSA25%Medium MSA17%Percent of
- Page 42 and 43:
Hispanics, who represent a growingp
- Page 45 and 46:
Wildlife WatchingU.S. Fish and Wild
- Page 47 and 48:
Wildlife-Watching ExpendituresThirt
- Page 49 and 50:
Wildlife Fed, Observed, orPhotograp
- Page 51 and 52:
Metropolitan and NonmetropolitanAro
- Page 53 and 54:
Education, Race, and Ethnicity ofAr
- Page 55 and 56:
Away-From-Home Participantsby Type
- Page 57 and 58:
Away-From-Home WildlifeWatchers by
- Page 59 and 60:
Metropolitan and NonmetropolitanAwa
- Page 61 and 62: 2001-2011 Comparison of Wildlife-Wa
- Page 63: 2006-2011 Wildlife-Watching Partici
- Page 66 and 67: Guide to Statistical TablesPurpose
- Page 68 and 69: Table 3. Freshwater Anglers and Day
- Page 70 and 71: Table 7. Hunters and Days of Huntin
- Page 72 and 73: Table 8. Selected Characteristics o
- Page 74 and 75: Table 9. Selected Characteristics o
- Page 76 and 77: Table 10. Selected Characteristics
- Page 78 and 79: Table 12. Expenditures for Fishing:
- Page 80 and 81: Table 14. Trip and Equipment Expend
- Page 82 and 83: Table 16. Trip and Equipment Expend
- Page 84 and 85: Table 18. Trip and Equipment Expend
- Page 86 and 87: Table 20. Trip and Equipment Expend
- Page 88 and 89: Table 22. Special Equipment Expendi
- Page 90 and 91: Table 25. Freshwater Anglers and Da
- Page 92 and 93: Table 29. Hunters and Days of Hunti
- Page 94 and 95: Table 33. Hunters Preparing for Hun
- Page 96 and 97: Table 37. Participation in Wildlife
- Page 98 and 99: Table 40. Expenditures for Wildlife
- Page 100 and 101: Table 41. Selected Characteristics
- Page 102 and 103: Table 42. Selected Characteristics
- Page 104 and 105: Table 46. Total Wildlife-Related Pa
- Page 106 and 107: Appendix A.DefinitionsAnnual househ
- Page 108 and 109: State governments (such as State pa
- Page 110 and 111: Appendix B.2010 Participation of 6-
- Page 114 and 115: Table B-7. Selected Characteristics
- Page 116 and 117: Table B-9. Participation by 6-to-15
- Page 118 and 119: Appendix C.Significant Methodologic
- Page 120 and 121: Table C-1. Major Characteristics of
- Page 122 and 123: Table C-2. Anglers and Hunters by C
- Page 124 and 125: household income in the 2001Survey.
- Page 126 and 127: Table C-4. Comparison of Major Find
- Page 128 and 129: Table C-5. Anglers and Hunters by C
- Page 130 and 131: Appendix D.Sample Design and Statis
- Page 132 and 133: lation 6 to 15 years of age were de
- Page 134 and 135: compute in advance the standard err
- Page 136 and 137: Illustration of the Computation of
- Page 138 and 139: Table D-2. Approximate Standard Err
- Page 140 and 141: Table D-4. Approximate Standard Err
- Page 143: U.S. Department of the InteriorU.S.