

National Survey of Fishing, Hunting, and Wildlife ... - All About Birds
National Survey of Fishing, Hunting, and Wildlife ... - All About Birds
National Survey of Fishing, Hunting, and Wildlife ... - All About Birds

You also want an ePaper? Increase the reach of your titles
YUMPU automatically turns print PDFs into web optimized ePapers that Google loves.
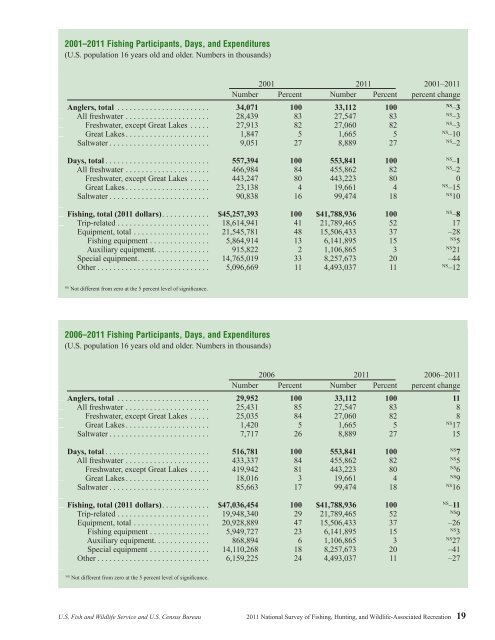
2001–2011 <strong>Fishing</strong> Participants, Days, <strong>and</strong> Expenditures(U.S. population 16 years old <strong>and</strong> older. Numbers in thous<strong>and</strong>s)Anglers, total ....................... 34,071<strong>All</strong> freshwater ..................... 28,439Freshwater, except Great Lakes ..... 27,913Great Lakes ..................... 1,847Saltwater ......................... 9,0512001 2011 2001–2011Number Percent Number Percent percent change100838252733,11227,54727,0601,6658,8891008382527NS–3NS–3NS–3NS–10NS–2Days, total .......................... 557,394<strong>All</strong> freshwater ..................... 466,984Freshwater, except Great Lakes ..... 443,247Great Lakes ..................... 23,138Saltwater ......................... 90,8381008480416553,841455,862443,22319,66199,4741008280418NS–1NS–20NS–15NS10<strong>Fishing</strong>, total (2011 dollars). ........... $45,257,393Trip-related ....................... 18,614,941Equipment, total ................... 21,545,781<strong>Fishing</strong> equipment ............... 5,864,914Auxiliary equipment. ............. 915,822Special equipment. ................. 14,765,019Other ............................ 5,096,66910041481323311$41,788,93621,789,46515,506,4336,141,8951,106,8658,257,6734,493,03710052371532011NS–817–28NS5NS21–44NS–12NSNot different from zero at the 5 percent level <strong>of</strong> significance.2006–2011 <strong>Fishing</strong> Participants, Days, <strong>and</strong> Expenditures(U.S. population 16 years old <strong>and</strong> older. Numbers in thous<strong>and</strong>s)Anglers, total ....................... 29,952<strong>All</strong> freshwater ..................... 25,431Freshwater, except Great Lakes ..... 25,035Great Lakes ..................... 1,420Saltwater ......................... 7,7172006 2011 2006–2011Number Percent Number Percent percent change100858452633,11227,54727,0601,6658,88910083825271188NS1715Days, total .......................... 516,781<strong>All</strong> freshwater ..................... 433,337Freshwater, except Great Lakes ..... 419,942Great Lakes ..................... 18,016Saltwater ......................... 85,6631008481317553,841455,862443,22319,66199,4741008280418NS7NS5NS6NS9NS16<strong>Fishing</strong>, total (2011 dollars). ........... $47,036,454Trip-related ....................... 19,948,340Equipment, total ................... 20,928,889<strong>Fishing</strong> equipment ............... 5,949,727Auxiliary equipment. ............. 868,894Special equipment ............... 14,110,268Other ............................ 6,159,22510029472361824$41,788,93621,789,46515,506,4336,141,8951,106,8658,257,6734,493,03710052371532011NS–11NS9–26NS3NS27–41–27NSNot different from zero at the 5 percent level <strong>of</strong> significance.U.S. Fish <strong>and</strong> <strong>Wildlife</strong> Service <strong>and</strong> U.S. Census Bureau 2011 <strong>National</strong> <strong>Survey</strong> <strong>of</strong> <strong>Fishing</strong>, <strong>Hunting</strong>, <strong>and</strong> <strong>Wildlife</strong>-Associated Recreation 19


