JANUS-Enterprise - SQL Server Reporting Services.pdf
JANUS-Enterprise - SQL Server Reporting Services.pdf
JANUS-Enterprise - SQL Server Reporting Services.pdf

You also want an ePaper? Increase the reach of your titles
YUMPU automatically turns print PDFs into web optimized ePapers that Google loves.
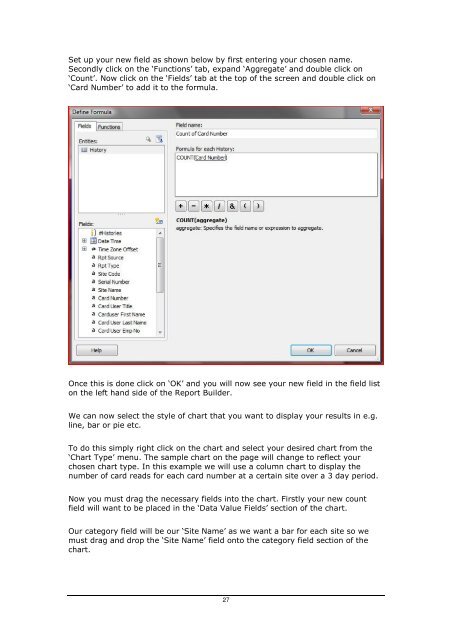
Set up your new field as shown below by first entering your chosen name.Secondly click on the ‘Functions’ tab, expand ‘Aggregate’ and double click on‘Count’. Now click on the ‘Fields’ tab at the top of the screen and double click on‘Card Number’ to add it to the formula.Once this is done click on ‘OK’ and you will now see your new field in the field liston the left hand side of the Report Builder.We can now select the style of chart that you want to display your results in e.g.line, bar or pie etc.To do this simply right click on the chart and select your desired chart from the‘Chart Type’ menu. The sample chart on the page will change to reflect yourchosen chart type. In this example we will use a column chart to display thenumber of card reads for each card number at a certain site over a 3 day period.Now you must drag the necessary fields into the chart. Firstly your new countfield will want to be placed in the ‘Data Value Fields’ section of the chart.Our category field will be our ‘Site Name’ as we want a bar for each site so wemust drag and drop the ‘Site Name’ field onto the category field section of thechart.27