- Page 3 and 4: Our Vision... is to be a leading co
- Page 5: Chairman’s StatementDear Valued S
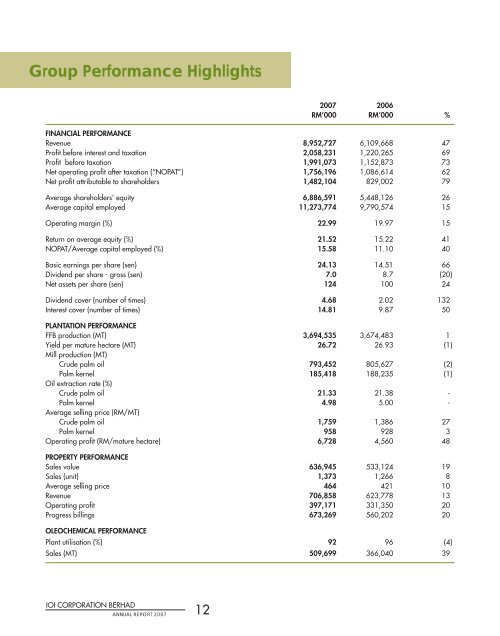
- Page 12: Responsibility“ Today, more than
- Page 20 and 21: Efficiency“The future belongs to
- Page 22 and 23: Management’s Discussion and Analy
- Page 24 and 25: Management’s Discussion and Analy
- Page 26 and 27: Management’s Discussion and Analy
- Page 28 and 29: Management’s Discussion and Analy
- Page 30 and 31: PALM OIL BUSINESS STREAMManagement
- Page 32 and 33: Management’s Discussion and Analy
- Page 34 and 35: Management’s Discussion and Analy
- Page 36 and 37: Management’s Discussion and Analy
- Page 38 and 39: Management’s Discussion and Analy
- Page 40 and 41: CORPORATE SOCIAL RESPONSIBILITY (CS
- Page 42 and 43: Management’s Discussion and Analy
- Page 44 and 45: Management’s Discussion and Analy
- Page 46 and 47: Management’s Discussion and Analy
- Page 48 and 49: Management’s Discussion and Analy
- Page 50 and 51: Management’s Discussion and Analy
- Page 52 and 53: Management’s Discussion and Analy
- Page 54 and 55: Management’s Discussion and Analy
- Page 56 and 57: Management’s Discussion and Analy
- Page 58 and 59: KepongKLCCKL SentralPetaling JayaKu
- Page 61 and 62: Corporate InformationBOARD OF DIREC
- Page 63 and 64:
Profile of Directors cont’dDATO
- Page 65 and 66:
Profile of Directors cont’dDATUK
- Page 68 and 69:
Excellence in ExecutionOur commitme
- Page 70 and 71:
Audit Committee Report cont’dTERM
- Page 72 and 73:
Audit Committee Report cont’dTERM
- Page 74 and 75:
Corporate GovernanceINTRODUCTIONThe
- Page 76 and 77:
Corporate Governance cont’dTHE BO
- Page 78 and 79:
Corporate Governance cont’dTHE BO
- Page 80 and 81:
Corporate Governance cont’dSHAREH
- Page 82 and 83:
Statement on Internal ControlINTROD
- Page 84 and 85:
Statement on Internal Control cont
- Page 86 and 87:
Other InformationCOMPOSITION OF SHA
- Page 88 and 89:
RECURRENT RELATED PARTY TRANSACTION
- Page 90 and 91:
Other Information cont’dPENALTIES
- Page 93 and 94:
Senior Management TeamGroup Chief E
- Page 95 and 96:
Global PresenceNORTH AMERICA• USA
- Page 97 and 98:
Location of Operations in MalaysiaP
- Page 99 and 100:
Corporate CalendarNov 2006• IOI P
- Page 101 and 102:
Corporate Calendar cont’dMarch200
- Page 103 and 104:
Social ContributionSep 2006• Yaya
- Page 105 and 106:
Social Contributions cont’dMay 20
- Page 107 and 108:
Directors’ ReportThe Directors of
- Page 109 and 110:
Directors’ Report cont’dUSD310
- Page 111 and 112:
Directors’ Report cont’dExecuti
- Page 113 and 114:
Directors’ Report cont’dReserve
- Page 115 and 116:
Directors’ Report cont’dDirecto
- Page 117 and 118:
Directors’ Report cont’dStatuto
- Page 119 and 120:
Directors’ Report cont’dSignifi
- Page 121 and 122:
Directors’ Report cont’dSignifi
- Page 123 and 124:
Income Statementsfor the financial
- Page 125 and 126:
Balance Sheets cont’das at 30 Jun
- Page 127 and 128:
Statements Of Changes In Equity con
- Page 129 and 130:
Statements Of Changes In Equity con
- Page 131 and 132:
Cash Flow Statements cont’dfor th
- Page 133 and 134:
Cash Flow Statements cont’dfor th
- Page 135 and 136:
Notes To The Financial Statements c
- Page 137 and 138:
Notes To The Financial Statements c
- Page 139 and 140:
Notes To The Financial Statements c
- Page 141 and 142:
Notes To The Financial Statements c
- Page 143 and 144:
Notes To The Financial Statements c
- Page 145 and 146:
Notes To The Financial Statements c
- Page 147 and 148:
Notes To The Financial Statements c
- Page 149 and 150:
Notes To The Financial Statements c
- Page 151 and 152:
Notes To The Financial Statements c
- Page 153 and 154:
Notes To The Financial Statements c
- Page 155 and 156:
Notes To The Financial Statements c
- Page 157 and 158:
Notes To The Financial Statements c
- Page 159 and 160:
Notes To The Financial Statements c
- Page 161 and 162:
Notes To The Financial Statements c
- Page 163 and 164:
Notes To The Financial Statements c
- Page 165 and 166:
Notes To The Financial Statements c
- Page 167 and 168:
Notes To The Financial Statements c
- Page 169 and 170:
Notes To The Financial Statements c
- Page 171 and 172:
Notes To The Financial Statements c
- Page 173 and 174:
Notes To The Financial Statements c
- Page 175 and 176:
Notes To The Financial Statements c
- Page 177 and 178:
Notes To The Financial Statements c
- Page 179 and 180:
Notes To The Financial Statements c
- Page 181 and 182:
Notes To The Financial Statements c
- Page 183 and 184:
Notes To The Financial Statements c
- Page 185 and 186:
Notes To The Financial Statements c
- Page 187 and 188:
Notes To The Financial Statements c
- Page 189 and 190:
Notes To The Financial Statements c
- Page 191 and 192:
Notes To The Financial Statements c
- Page 193 and 194:
Notes To The Financial Statements c
- Page 195 and 196:
Notes To The Financial Statements c
- Page 197 and 198:
Notes To The Financial Statements c
- Page 199 and 200:
Notes To The Financial Statements c
- Page 201 and 202:
Notes To The Financial Statements c
- Page 203 and 204:
Notes To The Financial Statements c
- Page 205 and 206:
Notes To The Financial Statements c
- Page 207 and 208:
Notes To The Financial Statements c
- Page 209 and 210:
Notes To The Financial Statements c
- Page 211 and 212:
Notes To The Financial Statements c
- Page 213 and 214:
Notes To The Financial Statements c
- Page 215 and 216:
Notes To The Financial Statements c
- Page 217 and 218:
Notes To The Financial Statements c
- Page 219 and 220:
Notes To The Financial Statements c
- Page 221 and 222:
Notes To The Financial Statements c
- Page 223 and 224:
Notes To The Financial Statements c
- Page 225 and 226:
Notes To The Financial Statements c
- Page 227 and 228:
Notes To The Financial Statements c
- Page 229 and 230:
Notes To The Financial Statements c
- Page 231 and 232:
Notes To The Financial Statements c
- Page 233 and 234:
Notes To The Financial Statements c
- Page 235 and 236:
Notes To The Financial Statements c
- Page 237 and 238:
Notes To The Financial Statements c
- Page 239 and 240:
Notes To The Financial Statements c
- Page 241 and 242:
Notes To The Financial Statements c
- Page 243 and 244:
Notes To The Financial Statements c
- Page 245 and 246:
Notes To The Financial Statements c
- Page 247 and 248:
Notes To The Financial Statements c
- Page 249 and 250:
Notes To The Financial Statements c
- Page 251 and 252:
Notes To The Financial Statements c
- Page 253 and 254:
Notes To The Financial Statements c
- Page 255 and 256:
Notes To The Financial Statements c
- Page 257 and 258:
Notes To The Financial Statements c
- Page 259 and 260:
Statement By DirectorsIn the opinio
- Page 261 and 262:
Group PropertiesA. PLANTATION ESTAT
- Page 263 and 264:
Group Properties cont’dA. PLANTAT
- Page 265 and 266:
Group Properties cont’dB. DEVELOP
- Page 267 and 268:
Group Properties cont’dC. INVESTM
- Page 269 and 270:
Group Properties cont’dD. INDUSTR
- Page 271 and 272:
Group Properties cont’dE. OTHER P
- Page 273 and 274:
Notice of Annual General MeetingNOT
- Page 275 and 276:
Notice of Annual General Meeting co
- Page 277 and 278:
Statement Accompanying Noticeof Ann
- Page 279 and 280:
Shareholders Information cont’das
- Page 281 and 282:
This page has been intentionally le
- Page 283 and 284:
fold herestampThe Company Secretary