- Page 4 and 5: contents002 Chairman’s Statement0
- Page 9: Chairman’s Statement cont’dUPDA
- Page 14 and 15: Group Financial Overview cont’dBa
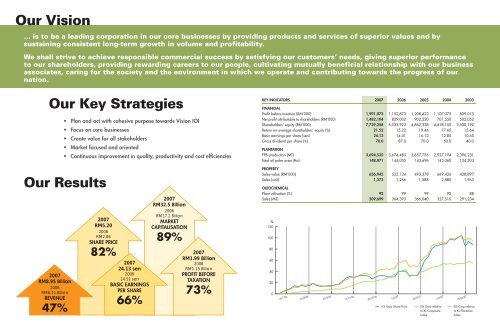
- Page 18: Five-Year Financial Highlights8091,
- Page 21 and 22: Management’s Discussion and Analy
- Page 23 and 24: Management’s Discussion and Analy
- Page 25 and 26: Management’s Discussion and Analy
- Page 27 and 28: Management’s Discussion and Analy
- Page 29 and 30: Management’s Discussion and Analy
- Page 31 and 32: Plantation
- Page 33 and 34: Management’s Discussion and Analy
- Page 35 and 36: Management’s Discussion and Analy
- Page 37 and 38: Management’s Discussion and Analy
- Page 39 and 40: Corporate SocialResponsibility
- Page 41 and 42: Management’s Discussion and Analy
- Page 43 and 44: Management’s Discussion and Analy
- Page 45 and 46: Management’s Discussion and Analy
- Page 47 and 48: Manufacturing
- Page 49 and 50: Management’s Discussion and Analy
- Page 51 and 52: Management’s Discussion and Analy
- Page 53 and 54:
Properties
- Page 55 and 56:
Management’s Discussion and Analy
- Page 57 and 58:
Management’s Discussion and Analy
- Page 59:
SustainabilityEducation for sustain
- Page 62 and 63:
Profile of DirectorsTAN SRI DATO’
- Page 64 and 65:
Profile of Directors cont’dDATO
- Page 66:
Profile of Directors cont’dCHAN F
- Page 69 and 70:
Audit Committee ReportMEMBERSDATUK
- Page 71 and 72:
Audit Committee Report cont’dTERM
- Page 73 and 74:
Audit Committee Report cont’dACTI
- Page 75 and 76:
Corporate Governance cont’dTHE BO
- Page 77 and 78:
Corporate Governance cont’dTHE BO
- Page 79 and 80:
Corporate Governance cont’dTHE BO
- Page 81 and 82:
Corporate Governance cont’dACCOUN
- Page 83 and 84:
Statement on Internal Control cont
- Page 85 and 86:
Statement of Directors’ Interests
- Page 87 and 88:
Other Information cont’dRECURRENT
- Page 89 and 90:
Other Information cont’dRECURRENT
- Page 91:
Community CareWe place emphasis on
- Page 94 and 95:
Group Business StructurePLANTATIONI
- Page 96 and 97:
EUROPE• Netherlands - Wormerveer
- Page 98 and 99:
Kota Kinabalu AirportSABAH302926282
- Page 100 and 101:
Corporate Calendar cont’dJan 2007
- Page 102 and 103:
Corporate Calendar cont’dJune2007
- Page 104 and 105:
Social Contributions cont’dDec 20
- Page 106 and 107:
financialstatement104 Directors’
- Page 108 and 109:
Directors’ Report cont’dIssue o
- Page 110 and 111:
Directors’ Report cont’dExecuti
- Page 112 and 113:
Directors’ Report cont’dExecuti
- Page 114 and 115:
Directors’ Report cont’dDirecto
- Page 116 and 117:
Directors’ Report cont’dDirecto
- Page 118 and 119:
Directors’ Report cont’dSignifi
- Page 120 and 121:
Directors’ Report cont’dSignifi
- Page 122 and 123:
Directors’ Report cont’dNominat
- Page 124 and 125:
Balance Sheetsas at 30 June 2007Gro
- Page 126 and 127:
Statements Of Changes In Equityfor
- Page 128 and 129:
Statements Of Changes In Equity con
- Page 130 and 131:
Cash Flow Statementsfor the financi
- Page 132 and 133:
Cash Flow Statements cont’dfor th
- Page 134 and 135:
Notes To The Financial Statements1.
- Page 136 and 137:
Notes To The Financial Statements c
- Page 138 and 139:
Notes To The Financial Statements c
- Page 140 and 141:
Notes To The Financial Statements c
- Page 142 and 143:
Notes To The Financial Statements c
- Page 144 and 145:
Notes To The Financial Statements c
- Page 146 and 147:
Notes To The Financial Statements c
- Page 148 and 149:
Notes To The Financial Statements c
- Page 150 and 151:
Notes To The Financial Statements c
- Page 152 and 153:
Notes To The Financial Statements c
- Page 154 and 155:
Notes To The Financial Statements c
- Page 156 and 157:
Notes To The Financial Statements c
- Page 158 and 159:
Notes To The Financial Statements c
- Page 160 and 161:
Notes To The Financial Statements c
- Page 162 and 163:
Notes To The Financial Statements c
- Page 164 and 165:
Notes To The Financial Statements c
- Page 166 and 167:
Notes To The Financial Statements c
- Page 168 and 169:
Notes To The Financial Statements c
- Page 170 and 171:
Notes To The Financial Statements c
- Page 172 and 173:
Notes To The Financial Statements c
- Page 174 and 175:
Notes To The Financial Statements c
- Page 176 and 177:
Notes To The Financial Statements c
- Page 178 and 179:
Notes To The Financial Statements c
- Page 180 and 181:
Notes To The Financial Statements c
- Page 182 and 183:
Notes To The Financial Statements c
- Page 184 and 185:
Notes To The Financial Statements c
- Page 186 and 187:
Notes To The Financial Statements c
- Page 188 and 189:
Notes To The Financial Statements c
- Page 190 and 191:
Notes To The Financial Statements c
- Page 192 and 193:
Notes To The Financial Statements c
- Page 194 and 195:
Notes To The Financial Statements c
- Page 196 and 197:
Notes To The Financial Statements c
- Page 198 and 199:
Notes To The Financial Statements c
- Page 200 and 201:
Notes To The Financial Statements c
- Page 202 and 203:
Notes To The Financial Statements c
- Page 204 and 205:
Notes To The Financial Statements c
- Page 206 and 207:
Notes To The Financial Statements c
- Page 208 and 209:
Notes To The Financial Statements c
- Page 210 and 211:
Notes To The Financial Statements c
- Page 212 and 213:
Notes To The Financial Statements c
- Page 214 and 215:
Notes To The Financial Statements c
- Page 216 and 217:
Notes To The Financial Statements c
- Page 218 and 219:
Notes To The Financial Statements c
- Page 220 and 221:
Notes To The Financial Statements c
- Page 222 and 223:
Notes To The Financial Statements c
- Page 224 and 225:
Notes To The Financial Statements c
- Page 226 and 227:
Notes To The Financial Statements c
- Page 228 and 229:
Notes To The Financial Statements c
- Page 230 and 231:
Notes To The Financial Statements c
- Page 232 and 233:
Notes To The Financial Statements c
- Page 234 and 235:
Notes To The Financial Statements c
- Page 236 and 237:
Notes To The Financial Statements c
- Page 238 and 239:
Notes To The Financial Statements c
- Page 240 and 241:
Notes To The Financial Statements c
- Page 242 and 243:
Notes To The Financial Statements c
- Page 244 and 245:
Notes To The Financial Statements c
- Page 246 and 247:
Notes To The Financial Statements c
- Page 248 and 249:
Notes To The Financial Statements c
- Page 250 and 251:
Notes To The Financial Statements c
- Page 252 and 253:
Notes To The Financial Statements c
- Page 254 and 255:
Notes To The Financial Statements c
- Page 256 and 257:
Notes To The Financial Statements c
- Page 258 and 259:
Notes To The Financial Statements c
- Page 260 and 261:
Report Of The Auditorsto the member
- Page 262 and 263:
Group Properties cont’dA. PLANTAT
- Page 264 and 265:
Group Properties cont’dB. DEVELOP
- Page 266 and 267:
Group Properties cont’dB. DEVELOP
- Page 268 and 269:
Group Properties cont’dD. INDUSTR
- Page 270 and 271:
Group Properties cont’dE. OTHER P
- Page 272 and 273:
Group Properties cont’dE. OTHER P
- Page 274 and 275:
Notice of Annual General Meeting co
- Page 276 and 277:
Notice of Annual General Meeting co
- Page 278 and 279:
Shareholders Informationas at 30 Au
- Page 280 and 281:
Shareholders Informationas at 30 Au
- Page 282 and 283:
PROXY FORMIOI Corporation Berhad (C
- Page 284:
www.ioigroup.com