

International Energy Outlook 2011 - EIA
International Energy Outlook 2011 - EIA
International Energy Outlook 2011 - EIA

Create successful ePaper yourself
Turn your PDF publications into a flip-book with our unique Google optimized e-Paper software.
U.S. <strong>Energy</strong> Information Administration | <strong>International</strong> <strong>Energy</strong> <strong>Outlook</strong> <strong>2011</strong><br />
Highlights<br />
Contributing to the strong competitive position of natural gas among other energy sources is a strong growth outlook for reserves<br />
and supplies. Significant changes in natural gas supplies and global markets occur with the expansion of liquefied natural gas (LNG)<br />
production capacity and as new drilling techniques and other efficiencies make production from many shale basins economical<br />
worldwide. The net impact is a significant increase in resource availability, which contributes to lower prices and higher demand<br />
for natural gas in the projection.<br />
Although the extent of the world’s unconventional natural gas resources—tight gas, shale gas, and coalbed methane—have not yet<br />
been assessed fully, the IEO<strong>2011</strong> Reference case projects a substantial increase in those supplies, especially from the United States<br />
but also from Canada and China. An initial assessment of shale gas resources in 32 countries was released by <strong>EIA</strong> in April <strong>2011</strong>. 6<br />
The report found that technically recoverable shale gas resources in the assessed shale gas basins and the United States amount<br />
to 6,622 trillion cubic feet. To put the shale gas resource estimate in perspective, according to the Oil & Gas Journal 7 world proven<br />
reserves of natural gas as of January 1, <strong>2011</strong>, are about 6,675 trillion cubic feet, and world technically recoverable gas resources—<br />
largely excluding shale gas—are roughly 16,000 trillion cubic feet.<br />
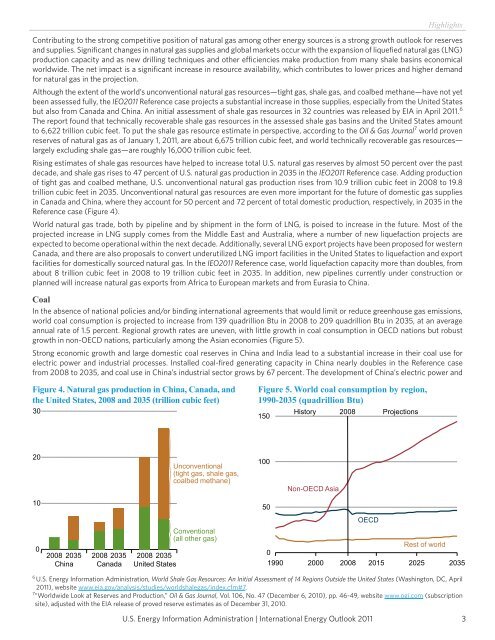
Rising estimates of shale gas resources have helped to increase total U.S. natural gas reserves by almost 50 percent over the past<br />
decade, and shale gas rises to 47 percent of U.S. natural gas production in 2035 in the IEO<strong>2011</strong> Reference case. Adding production<br />
of tight gas and coalbed methane, U.S. unconventional natural gas production rises from 10.9 trillion cubic feet in 2008 to 19.8<br />
trillion cubic feet in 2035. Unconventional natural gas resources are even more important for the future of domestic gas supplies<br />
in Canada and China, where they account for 50 percent and 72 percent of total domestic production, respectively, in 2035 in the<br />
Reference case (Figure 4).<br />
World natural gas trade, both by pipeline and by shipment in the form of LNG, is poised to increase in the future. Most of the<br />
projected increase in LNG supply comes from the Middle East and Australia, where a number of new liquefaction projects are<br />
expected to become operational within the next decade. Additionally, several LNG export projects have been proposed for western<br />
Canada, and there are also proposals to convert underutilized LNG import facilities in the United States to liquefaction and export<br />
facilities for domestically sourced natural gas. In the IEO<strong>2011</strong> Reference case, world liquefaction capacity more than doubles, from<br />
about 8 trillion cubic feet in 2008 to 19 trillion cubic feet in 2035. In addition, new pipelines currently under construction or<br />
planned will increase natural gas exports from Africa to European markets and from Eurasia to China.<br />
Coal<br />
In the absence of national policies and/or binding international agreements that would limit or reduce greenhouse gas emissions,<br />
world coal consumption is projected to increase from 139 quadrillion Btu in 2008 to 209 quadrillion Btu in 2035, at an average<br />
annual rate of 1.5 percent. Regional growth rates are uneven, with little growth in coal consumption in OECD nations but robust<br />
growth in non-OECD nations, particularly among the Asian economies (Figure 5).<br />
Strong economic growth and large domestic coal reserves in China and India lead to a substantial increase in their coal use for<br />
electric power and industrial processes. Installed coal-fired generating capacity in China nearly doubles in the Reference case<br />
from 2008 to 2035, and coal use in China’s industrial sector grows by 67 percent. The development of China’s electric power and<br />
Figure 4. Natural gas production in China, Canada, and<br />
the United States, 2008 and 2035 (trillion cubic feet)<br />
30<br />
20<br />
10<br />
0<br />
2008 2035 2008 2035 2008 2035<br />
China Canada United States<br />
Unconventional<br />
(tight gas, shale gas,<br />
coalbed methane)<br />
Conventional<br />
(all other gas)<br />
Figure 5. World coal consumption by region,<br />
1990-2035 (quadrillion Btu)<br />
History 2008 Projections<br />
Rest of world<br />
0<br />
1990 2000 2008 2015 2025 2035<br />
6 U.S. <strong>Energy</strong> Information Administration, World Shale Gas Resources: An Initial Assessment of 14 Regions Outside the United States (Washington, DC, April<br />
<strong>2011</strong>), website www.eia.gov/analysis/studies/worldshalegas/index.cfm#7.<br />
7 “Worldwide Look at Reserves and Production,” Oil & Gas Journal, Vol. 106, No. 47 (December 6, 2010), pp. 46-49, website www.ogj.com (subscription<br />
site), adjusted with the <strong>EIA</strong> release of proved reserve estimates as of December 31, 2010.<br />
150<br />
100<br />
50<br />
Non-OECD Asia<br />
OECD<br />
3


