

International Energy Outlook 2011 - EIA
International Energy Outlook 2011 - EIA
International Energy Outlook 2011 - EIA

Create successful ePaper yourself
Turn your PDF publications into a flip-book with our unique Google optimized e-Paper software.
U.S. <strong>Energy</strong> Information Administration | <strong>International</strong> <strong>Energy</strong> <strong>Outlook</strong> <strong>2011</strong><br />
World energy demand and economic outlook<br />
and productivity improvements. In addition, for the developing economies, progress in building human and physical capital<br />
infrastructures, establishing credible regulatory mechanisms to govern markets, and ensuring political stability also are important<br />
determinants of medium- to long-term growth potential.<br />
Annual growth in world GDP over the 27-year projection period in IEO<strong>2011</strong> (3.4 percent per year) is similar to the rate recorded over<br />
the past 30 years (3.3 percent per year). Growth in the more mature, industrialized OECD economies is expected to be slower, and<br />
growth in the emerging non-OECD economies is projected to be higher, than in the past. The combined GDP of OECD countries,<br />
which increased by an annual average of 2.9 percent from 1977 to 2008, averages 2.1 percent per year from 2008 to 2035 in the<br />
Reference case. In contrast, the combined GDP of non-OECD countries, which increased by an annual average of 3.7 percent from<br />
1977 to 2008, averages 4.6 percent per year growth from 2008 to 2035, based in a large part on the strong growth projected for<br />
China and India. With non-OECD economies accounting for an increasing share of world GDP, their more rapid economic growth<br />
rates offset the slower growth rates for OECD economies in the Reference case (Figure 24).<br />
OECD economies<br />
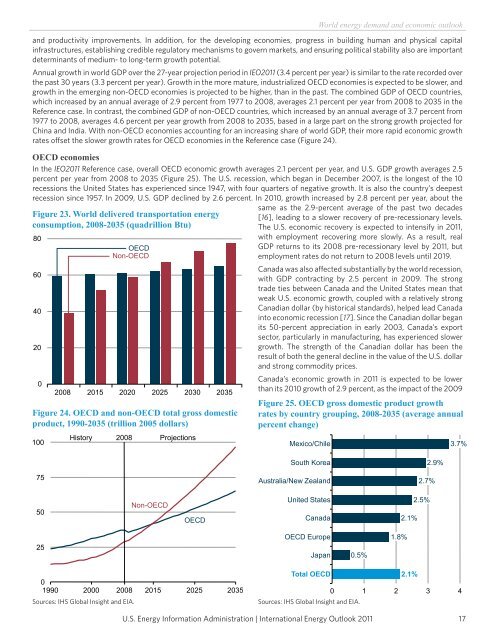
In the IEO<strong>2011</strong> Reference case, overall OECD economic growth averages 2.1 percent per year, and U.S. GDP growth averages 2.5<br />
percent per year from 2008 to 2035 (Figure 25). The U.S. recession, which began in December 2007, is the longest of the 10<br />
recessions the United States has experienced since 1947, with four quarters of negative growth. It is also the country’s deepest<br />
recession since 1957. In 2009, U.S. GDP declined by 2.6 percent. In 2010, growth increased by 2.8 percent per year, about the<br />
Figure 23. World delivered transportation energy<br />
consumption, 2008-2035 (quadrillion Btu)<br />
80<br />
60<br />
40<br />
20<br />
0<br />
100<br />
75<br />
50<br />
25<br />
OECD<br />
Non-OECD<br />
2008 2015 2020 2025 2030 2035<br />
Figure 24. OECD and non-OECD total gross domestic<br />
product, 1990-2035 (trillion 2005 dollars)<br />
History 2008 Projections<br />
Non-OECD<br />
OECD<br />
0<br />
1990 2000 2008 2015 2025 2035<br />
same as the 2.9-percent average of the past two decades<br />
[16], leading to a slower recovery of pre-recessionary levels.<br />
The U.S. economic recovery is expected to intensify in <strong>2011</strong>,<br />
with employment recovering more slowly. As a result, real<br />
GDP returns to its 2008 pre-recessionary level by <strong>2011</strong>, but<br />
employment rates do not return to 2008 levels until 2019.<br />
Canada was also affected substantially by the world recession,<br />
with GDP contracting by 2.5 percent in 2009. The strong<br />
trade ties between Canada and the United States mean that<br />
weak U.S. economic growth, coupled with a relatively strong<br />
Canadian dollar (by historical standards), helped lead Canada<br />
into economic recession [17]. Since the Canadian dollar began<br />
its 50-percent appreciation in early 2003, Canada’s export<br />
sector, particularly in manufacturing, has experienced slower<br />
growth. The strength of the Canadian dollar has been the<br />
result of both the general decline in the value of the U.S. dollar<br />
and strong commodity prices.<br />
Canada’s economic growth in <strong>2011</strong> is expected to be lower<br />
than its 2010 growth of 2.9 percent, as the impact of the 2009<br />
Figure 25. OECD gross domestic product growth<br />
rates by country grouping, 2008-2035 (average annual<br />
percent change)<br />
Mexico/Chile<br />
South Korea<br />
Australia/New Zealand<br />
United States<br />
Canada<br />
OECD Europe<br />
Japan<br />
Total OECD<br />
Sources: IHS Global Insight and <strong>EIA</strong>. Sources: IHS Global Insight and <strong>EIA</strong>.<br />
0.5%<br />
1.8%<br />
2.1%<br />
2.1%<br />
2.7%<br />
2.5%<br />
2.9%<br />
3.7%<br />
0 1 2 3 4<br />
17


