International Energy Outlook 2011 - EIA
International Energy Outlook 2011 - EIA
International Energy Outlook 2011 - EIA
You also want an ePaper? Increase the reach of your titles
YUMPU automatically turns print PDFs into web optimized ePapers that Google loves.
Chapter 1<br />
World energy demand and economic outlook<br />
Overview<br />
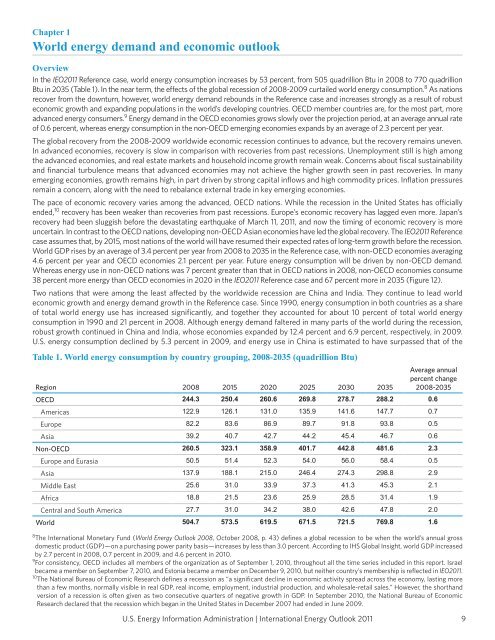
In the IEO<strong>2011</strong> Reference case, world energy consumption increases by 53 percent, from 505 quadrillion Btu in 2008 to 770 quadrillion<br />
Btu in 2035 (Table 1). In the near term, the effects of the global recession of 2008-2009 curtailed world energy consumption. 8 As nations<br />
recover from the downturn, however, world energy demand rebounds in the Reference case and increases strongly as a result of robust<br />
economic growth and expanding populations in the world’s developing countries. OECD member countries are, for the most part, more<br />
advanced energy consumers. 9 <strong>Energy</strong> demand in the OECD economies grows slowly over the projection period, at an average annual rate<br />
of 0.6 percent, whereas energy consumption in the non-OECD emerging economies expands by an average of 2.3 percent per year.<br />
The global recovery from the 2008-2009 worldwide economic recession continues to advance, but the recovery remains uneven.<br />
In advanced economies, recovery is slow in comparison with recoveries from past recessions. Unemployment still is high among<br />
the advanced economies, and real estate markets and household income growth remain weak. Concerns about fiscal sustainability<br />
and financial turbulence means that advanced economies may not achieve the higher growth seen in past recoveries. In many<br />
emerging economies, growth remains high, in part driven by strong capital inflows and high commodity prices. Inflation pressures<br />
remain a concern, along with the need to rebalance external trade in key emerging economies.<br />
The pace of economic recovery varies among the advanced, OECD nations. While the recession in the United States has officially<br />
ended, 10 recovery has been weaker than recoveries from past recessions. Europe’s economic recovery has lagged even more. Japan’s<br />
recovery had been sluggish before the devastating earthquake of March 11, <strong>2011</strong>, and now the timing of economic recovery is more<br />
uncertain. In contrast to the OECD nations, developing non-OECD Asian economies have led the global recovery. The IEO<strong>2011</strong> Reference<br />
case assumes that, by 2015, most nations of the world will have resumed their expected rates of long-term growth before the recession.<br />
World GDP rises by an average of 3.4 percent per year from 2008 to 2035 in the Reference case, with non-OECD economies averaging<br />
4.6 percent per year and OECD economies 2.1 percent per year. Future energy consumption will be driven by non-OECD demand.<br />
Whereas energy use in non-OECD nations was 7 percent greater than that in OECD nations in 2008, non-OECD economies consume<br />
38 percent more energy than OECD economies in 2020 in the IEO<strong>2011</strong> Reference case and 67 percent more in 2035 (Figure 12).<br />
Two nations that were among the least affected by the worldwide recession are China and India. They continue to lead world<br />
economic growth and energy demand growth in the Reference case. Since 1990, energy consumption in both countries as a share<br />
of total world energy use has increased significantly, and together they accounted for about 10 percent of total world energy<br />
consumption in 1990 and 21 percent in 2008. Although energy demand faltered in many parts of the world during the recession,<br />
robust growth continued in China and India, whose economies expanded by 12.4 percent and 6.9 percent, respectively, in 2009.<br />
U.S. energy consumption declined by 5.3 percent in 2009, and energy use in China is estimated to have surpassed that of the<br />
Table 1. World energy consumption by country grouping, 2008-2035 (quadrillion Btu)<br />
Region 2008 2015 2020 2025 2030 2035<br />
8 The <strong>International</strong> Monetary Fund (World <strong>Energy</strong> <strong>Outlook</strong> 2008, October 2008, p. 43) defines a global recession to be when the world’s annual gross<br />
domestic product (GDP)—on a purchasing power parity basis—increases by less than 3.0 percent. According to IHS Global Insight, world GDP increased<br />
by 2.7 percent in 2008, 0.7 percent in 2009, and 4.6 percent in 2010.<br />
9 For consistency, OECD includes all members of the organization as of September 1, 2010, throughout all the time series included in this report. Israel<br />
became a member on September 7, 2010, and Estonia became a member on December 9, 2010, but neither country’s membership is reflected in IEO<strong>2011</strong>.<br />
10 The National Bureau of Economic Research defines a recession as “a significant decline in economic activity spread across the economy, lasting more<br />
than a few months, normally visible in real GDP, real income, employment, industrial production, and wholesale-retail sales.” However, the shorthand<br />
version of a recession is often given as two consecutive quarters of negative growth in GDP. In September 2010, the National Bureau of Economic<br />
Research declared that the recession which began in the United States in December 2007 had ended in June 2009.<br />
U.S. <strong>Energy</strong> Information Administration | <strong>International</strong> <strong>Energy</strong> <strong>Outlook</strong> <strong>2011</strong><br />
Average annual<br />
percent change<br />
2008-2035<br />
OECD 244.3 250.4 260.6 269.8 278.7 288.2 0.6<br />
Americas 122.9 126.1 131.0 135.9 141.6 147.7 0.7<br />
Europe 82.2 83.6 86.9 89.7 91.8 93.8 0.5<br />
Asia 39.2 40.7 42.7 44.2 45.4 46.7 0.6<br />
Non-OECD 260.5 323.1 358.9 401.7 442.8 481.6 2.3<br />
Europe and Eurasia 50.5 51.4 52.3 54.0 56.0 58.4 0.5<br />
Asia 137.9 188.1 215.0 246.4 274.3 298.8 2.9<br />
Middle East 25.6 31.0 33.9 37.3 41.3 45.3 2.1<br />
Africa 18.8 21.5 23.6 25.9 28.5 31.4 1.9<br />
Central and South America 27.7 31.0 34.2 38.0 42.6 47.8 2.0<br />
World 504.7 573.5 619.5 671.5 721.5 769.8 1.6<br />
9


