

International Energy Outlook 2011 - EIA
International Energy Outlook 2011 - EIA
International Energy Outlook 2011 - EIA

You also want an ePaper? Increase the reach of your titles
YUMPU automatically turns print PDFs into web optimized ePapers that Google loves.
U.S. <strong>Energy</strong> Information Administration | <strong>International</strong> <strong>Energy</strong> <strong>Outlook</strong> <strong>2011</strong><br />
World energy demand and economic outlook<br />
As a result, the country’s export potential in <strong>2011</strong> was compromised and GDP growth potential was dampened significantly [28].<br />
Australia is expected to return to GDP growth of about 2.5 percent in <strong>2011</strong>, before accelerating again in 2012 and beyond [29].<br />
Non-OECD economies<br />
Overall economic growth in the non-OECD region averages 4.6 percent per year from 2008 to 2035 in the IEO<strong>2011</strong> Reference case<br />
(Figure 26), and growth in non-OECD Europe and Eurasia as a whole averages 2.7 percent per year. After several years of strong<br />
regional growth (the region’s GDP grew by an average of 6.7 percent per year from 2000 to 2008), GDP in non-OECD Europe and<br />
Eurasia contracted by 7.3 percent in 2009. The region has a fairly diverse set of economies, and while some economies suffered<br />
deep recessions in 2008-2009, others saw economic growth slow but remain positive.<br />
For the nations of non-OECD Europe and Eurasia, exports have led to increased growth in 2010, with household consumption<br />
showing signs of recovery in <strong>2011</strong>. In the face of large fiscal deficits, government expenditures have been under pressure in many<br />
nations of the region, and fiscal austerity measures are expected to restrain the pace of economic growth in the region into the<br />
medium term. Monetary policy also will have to be relatively cautious, given that higher prices for key imported commodities and<br />
food and a return of upward pressure from wages could increase the risk of building inflationary expectations.<br />
Beginning in late 2008, it became more difficult for banks and other entities in non-OECD Europe and Eurasia—particularly, Russia,<br />
Kazakhstan, and Ukraine—to gain access to foreign loans [30]. The impact was softened somewhat by higher world market prices<br />
for commodity exports, but with the subsequent collapse of commodity prices and worsening global economic situation, the<br />
region’s economic growth declined sharply. In the mid- to long term, a return to high world oil prices is expected to stimulate<br />
investment outlays, especially in the energy sector of the Caspian region. Given the volatility of energy market prices, however,<br />
it is unlikely that the economies of non-OECD Europe and Eurasia will be able to sustain their recent growth rates until they have<br />
achieved more broad-based diversification from energy production and exports.<br />
Much of the growth in world economic activity between 2008 and 2035 occurs among the nations of non-OECD Asia, where<br />
regional GDP growth averages 5.3 percent per year. China, non-OECD Asia’s largest economy, continues to play a major role in<br />
both the supply and demand sides of the global economy. IEO<strong>2011</strong> projects an average annual growth rate of approximately 5.7<br />
percent for China’s economy from 2008 to 2035—the highest among all the world’s economies.<br />
Non-OECD Asia has led the recovery from the 2008-2009 global economic recession. In China, substantial stimulus and tax breaks<br />
in 2009, along with considerable loosening of lending terms, allowed GDP growth to reach 9.1 percent, even with considerable<br />
deceleration of exports. Further, growth in property sales and real estate prices was substantial in 2010, supporting renewed<br />
strength in construction activity. In fact, there is growing concern on the part of the Chinese government about a possible housing<br />
bubble. In an effort to control rapidly increasing prices in the country’s real estate market, the government imposed restrictions<br />
on property acquisitions in more than 30 Chinese cities, making it more difficult for nonresidents to buy homes and for current<br />
homeowners to purchase second residences [31].<br />
The growth of domestic demand in China is supported by an increase in credit expansion, despite the repeated tightening moves<br />
by the People’s Bank of China—particularly in raising the reserve requirement ratio. Many non-OECD Asian economies that are<br />
trade partners with China also have benefited from their economic ties. Although those emerging Asian economies—particularly<br />
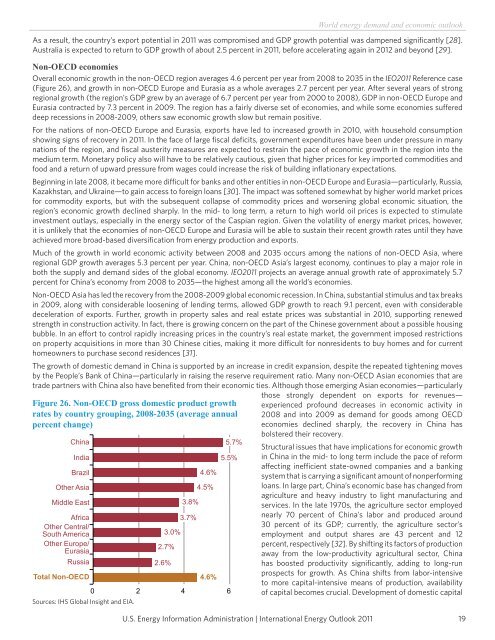
Figure 26. Non-OECD gross domestic product growth<br />
rates by country grouping, 2008-2035 (average annual<br />
percent change)<br />
China<br />
India<br />
Brazil<br />
Other Asia<br />
Middle East<br />
Africa<br />
Other Central/<br />
South America<br />
Other Europe/<br />
Eurasia<br />
Russia<br />
Total Non-OECD<br />
Sources: IHS Global Insight and <strong>EIA</strong>.<br />
2.7%<br />
2.6%<br />
3.0%<br />
3.8%<br />
3.7%<br />
4.6%<br />
4.5%<br />
4.6%<br />
5.7%<br />
5.5%<br />
0 2 4 6<br />
those strongly dependent on exports for revenues—<br />
experienced profound decreases in economic activity in<br />
2008 and into 2009 as demand for goods among OECD<br />
economies declined sharply, the recovery in China has<br />
bolstered their recovery.<br />
Structural issues that have implications for economic growth<br />
in China in the mid- to long term include the pace of reform<br />
affecting inefficient state-owned companies and a banking<br />
system that is carrying a significant amount of nonperforming<br />
loans. In large part, China’s economic base has changed from<br />
agriculture and heavy industry to light manufacturing and<br />
services. In the late 1970s, the agriculture sector employed<br />
nearly 70 percent of China’s labor and produced around<br />
30 percent of its GDP; currently, the agriculture sector’s<br />
employment and output shares are 43 percent and 12<br />
percent, respectively [32]. By shifting its factors of production<br />
away from the low-productivity agricultural sector, China<br />
has boosted productivity significantly, adding to long-run<br />
prospects for growth. As China shifts from labor-intensive<br />
to more capital-intensive means of production, availability<br />
of capital becomes crucial. Development of domestic capital<br />
19


