

International Energy Outlook 2011 - EIA
International Energy Outlook 2011 - EIA
International Energy Outlook 2011 - EIA

Create successful ePaper yourself
Turn your PDF publications into a flip-book with our unique Google optimized e-Paper software.
U.S. <strong>Energy</strong> Information Administration | <strong>International</strong> <strong>Energy</strong> <strong>Outlook</strong> <strong>2011</strong><br />
Highlights<br />
largest increment in world net installed nuclear power from 2008 to 2035: China adds 106 gigawatts of nuclear capacity over the<br />
period, Russia 28 gigawatts, and India 24 gigawatts.<br />
World delivered energy use by sector<br />
This section discusses delivered energy use in the buildings, industrial, and transportation sectors; it does not include losses<br />
associated with electricity generation and transmission.<br />
Residential and commercial buildings<br />
World residential energy use increases by 1.1 percent per year, from 52 quadrillion Btu in 2008 to 69 quadrillion Btu in 2035 in<br />
the IEO<strong>2011</strong> Reference case. Much of the growth in residential energy consumption occurs in non-OECD nations, where robust<br />
economic growth improves standards of living and increases demand for residential energy. One factor contributing to increased<br />
demand in non-OECD nations is the trend toward replacing nonmarketed energy sources (including wood and waste, which are<br />
not fully included in the energy demand totals shown in the IEO) with marketed fuels, such as propane and electricity, for cooking<br />
and heating. Non-OECD residential energy consumption rises by 1.9 percent per year, compared with the much slower rate of 0.3<br />
percent per year for OECD countries, where patterns of residential energy use already are well established, and slower population<br />
growth and aging populations translate to smaller increases in energy demand.<br />
Globally, IEO<strong>2011</strong> projects average growth in commercial energy use of 1.5 percent per year through 2035, with the largest share<br />
of growth in non-OECD nations. OECD commercial energy use expands by 0.8 percent per year. Slow expansion of GDP and low<br />
or declining population growth in many OECD nations contribute to slower anticipated rates of growth in commercial energy<br />
demand. In addition, continued efficiency improvements moderate the growth of energy demand over time, as relatively inefficient<br />
equipment is replaced with newer, more efficient stock.<br />
In non-OECD nations, economic activity and commerce increase rapidly over the 2008-2035 projection period, fueling additional<br />
demand for energy in the service sectors. Total delivered commercial energy use among non-OECD nations is projected to grow by<br />
2.8 percent per year from 2008 to 2035. Population growth also is expected to be more rapid than in OECD countries, portending<br />
increases in the need for education, health care, and social services and the energy required to provide them. In addition, as<br />
developing nations mature, they are expected to transition to more service-related enterprises, which will increase demand for<br />
energy in the commercial sector.<br />
Industrial<br />
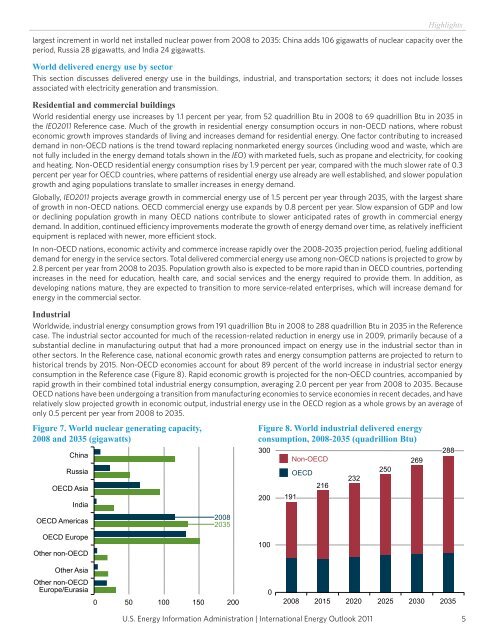
Worldwide, industrial energy consumption grows from 191 quadrillion Btu in 2008 to 288 quadrillion Btu in 2035 in the Reference<br />
case. The industrial sector accounted for much of the recession-related reduction in energy use in 2009, primarily because of a<br />
substantial decline in manufacturing output that had a more pronounced impact on energy use in the industrial sector than in<br />
other sectors. In the Reference case, national economic growth rates and energy consumption patterns are projected to return to<br />
historical trends by 2015. Non-OECD economies account for about 89 percent of the world increase in industrial sector energy<br />
consumption in the Reference case (Figure 8). Rapid economic growth is projected for the non-OECD countries, accompanied by<br />
rapid growth in their combined total industrial energy consumption, averaging 2.0 percent per year from 2008 to 2035. Because<br />
OECD nations have been undergoing a transition from manufacturing economies to service economies in recent decades, and have<br />
relatively slow projected growth in economic output, industrial energy use in the OECD region as a whole grows by an average of<br />
only 0.5 percent per year from 2008 to 2035.<br />
Figure 7. World nuclear generating capacity,<br />
2008 and 2035 (gigawatts)<br />
China<br />
Russia<br />
OECD Asia<br />
India<br />
OECD Americas<br />
OECD Europe<br />
Other non-OECD<br />
Other Asia<br />
Other non-OECD<br />
Europe/Eurasia<br />
2008<br />
2035<br />
0 50 100 150 200<br />
Figure 8. World industrial delivered energy<br />
consumption, 2008-2035 (quadrillion Btu)<br />
300<br />
200<br />
100<br />
0<br />
191<br />
Non-OECD<br />
OECD<br />
216<br />
232<br />
250<br />
269<br />
288<br />
2008 2015 2020 2025 2030 2035<br />
5


