

International Energy Outlook 2011 - EIA
International Energy Outlook 2011 - EIA
International Energy Outlook 2011 - EIA

You also want an ePaper? Increase the reach of your titles
YUMPU automatically turns print PDFs into web optimized ePapers that Google loves.
U.S. <strong>Energy</strong> Information Administration | <strong>International</strong> <strong>Energy</strong> <strong>Outlook</strong> <strong>2011</strong><br />
World energy demand and economic outlook<br />
increase despite rising prices, given the expectation that liquids will continue to dominate transportation markets absent significant<br />
technological advances. World liquids consumption for transportation grows by 1.4 percent per year from 2008 to 2035 and<br />
accounts for 82 percent of the total projected increment in liquid fuel use.<br />
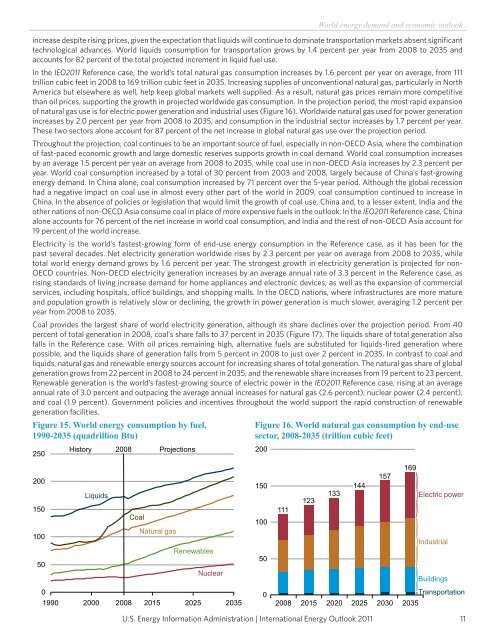
In the IEO<strong>2011</strong> Reference case, the world’s total natural gas consumption increases by 1.6 percent per year on average, from 111<br />
trillion cubic feet in 2008 to 169 trillion cubic feet in 2035. Increasing supplies of unconventional natural gas, particularly in North<br />
America but elsewhere as well, help keep global markets well supplied. As a result, natural gas prices remain more competitive<br />
than oil prices, supporting the growth in projected worldwide gas consumption. In the projection period, the most rapid expansion<br />
of natural gas use is for electric power generation and industrial uses (Figure 16). Worldwide natural gas used for power generation<br />
increases by 2.0 percent per year from 2008 to 2035, and consumption in the industrial sector increases by 1.7 percent per year.<br />
These two sectors alone account for 87 percent of the net increase in global natural gas use over the projection period.<br />
Throughout the projection, coal continues to be an important source of fuel, especially in non-OECD Asia, where the combination<br />
of fast-paced economic growth and large domestic reserves supports growth in coal demand. World coal consumption increases<br />
by an average 1.5 percent per year on average from 2008 to 2035, while coal use in non-OECD Asia increases by 2.3 percent per<br />
year. World coal consumption increased by a total of 30 percent from 2003 and 2008, largely because of China’s fast-growing<br />
energy demand. In China alone, coal consumption increased by 71 percent over the 5-year period. Although the global recession<br />
had a negative impact on coal use in almost every other part of the world in 2009, coal consumption continued to increase in<br />
China. In the absence of policies or legislation that would limit the growth of coal use, China and, to a lesser extent, India and the<br />
other nations of non-OECD Asia consume coal in place of more expensive fuels in the outlook. In the IEO<strong>2011</strong> Reference case, China<br />
alone accounts for 76 percent of the net increase in world coal consumption, and India and the rest of non-OECD Asia account for<br />
19 percent of the world increase.<br />
Electricity is the world’s fastest-growing form of end-use energy consumption in the Reference case, as it has been for the<br />
past several decades. Net electricity generation worldwide rises by 2.3 percent per year on average from 2008 to 2035, while<br />
total world energy demand grows by 1.6 percent per year. The strongest growth in electricity generation is projected for non-<br />
OECD countries. Non-OECD electricity generation increases by an average annual rate of 3.3 percent in the Reference case, as<br />
rising standards of living increase demand for home appliances and electronic devices, as well as the expansion of commercial<br />
services, including hospitals, office buildings, and shopping malls. In the OECD nations, where infrastructures are more mature<br />
and population growth is relatively slow or declining, the growth in power generation is much slower, averaging 1.2 percent per<br />
year from 2008 to 2035.<br />
Coal provides the largest share of world electricity generation, although its share declines over the projection period. From 40<br />
percent of total generation in 2008, coal’s share falls to 37 percent in 2035 (Figure 17). The liquids share of total generation also<br />
falls in the Reference case. With oil prices remaining high, alternative fuels are substituted for liquids-fired generation where<br />
possible, and the liquids share of generation falls from 5 percent in 2008 to just over 2 percent in 2035. In contrast to coal and<br />
liquids, natural gas and renewable energy sources account for increasing shares of total generation. The natural gas share of global<br />
generation grows from 22 percent in 2008 to 24 percent in 2035, and the renewable share increases from 19 percent to 23 percent.<br />
Renewable generation is the world’s fastest-growing source of electric power in the IEO<strong>2011</strong> Reference case, rising at an average<br />
annual rate of 3.0 percent and outpacing the average annual increases for natural gas (2.6 percent), nuclear power (2.4 percent),<br />
and coal (1.9 percent). Government policies and incentives throughout the world support the rapid construction of renewable<br />
generation facilities.<br />
Figure 15. World energy consumption by fuel,<br />
1990-2035 (quadrillion Btu)<br />
250<br />
200<br />
150<br />
100<br />
50<br />
0<br />
History 2008 Projections<br />
Liquids<br />
Coal<br />
Natural gas<br />
Renewables<br />
Nuclear<br />
1990 2000 2008 2015 2025 2035<br />
Figure 16. World natural gas consumption by end-use<br />
sector, 2008-2035 (trillion cubic feet)<br />
200<br />
150<br />
100<br />
50<br />
0<br />
111<br />
123<br />
133<br />
144<br />
157<br />
169<br />
2008 2015 2020 2025 2030 2035<br />
Electric power<br />
Industrial<br />
Buildings<br />
Transportation<br />
11


