

International Energy Outlook 2011 - EIA
International Energy Outlook 2011 - EIA
International Energy Outlook 2011 - EIA

You also want an ePaper? Increase the reach of your titles
YUMPU automatically turns print PDFs into web optimized ePapers that Google loves.
U.S. <strong>Energy</strong> Information Administration | <strong>International</strong> <strong>Energy</strong> <strong>Outlook</strong> <strong>2011</strong><br />
World energy demand and economic outlook<br />
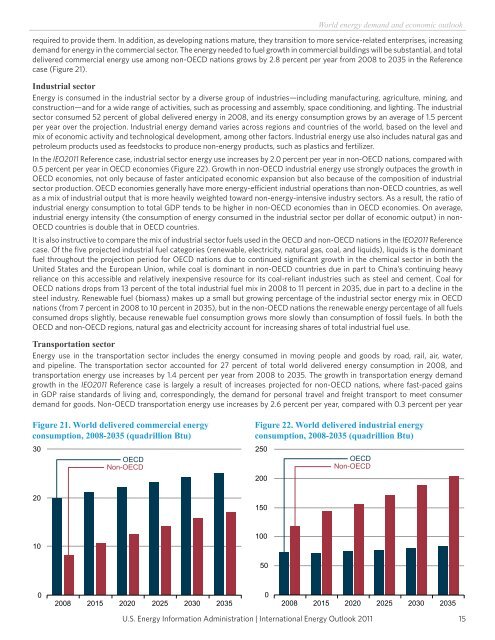
required to provide them. In addition, as developing nations mature, they transition to more service-related enterprises, increasing<br />
demand for energy in the commercial sector. The energy needed to fuel growth in commercial buildings will be substantial, and total<br />
delivered commercial energy use among non-OECD nations grows by 2.8 percent per year from 2008 to 2035 in the Reference<br />
case (Figure 21).<br />
Industrial sector<br />
<strong>Energy</strong> is consumed in the industrial sector by a diverse group of industries—including manufacturing, agriculture, mining, and<br />
construction—and for a wide range of activities, such as processing and assembly, space conditioning, and lighting. The industrial<br />
sector consumed 52 percent of global delivered energy in 2008, and its energy consumption grows by an average of 1.5 percent<br />
per year over the projection. Industrial energy demand varies across regions and countries of the world, based on the level and<br />
mix of economic activity and technological development, among other factors. Industrial energy use also includes natural gas and<br />
petroleum products used as feedstocks to produce non-energy products, such as plastics and fertilizer.<br />
In the IEO<strong>2011</strong> Reference case, industrial sector energy use increases by 2.0 percent per year in non-OECD nations, compared with<br />
0.5 percent per year in OECD economies (Figure 22). Growth in non-OECD industrial energy use strongly outpaces the growth in<br />
OECD economies, not only because of faster anticipated economic expansion but also because of the composition of industrial<br />
sector production. OECD economies generally have more energy-efficient industrial operations than non-OECD countries, as well<br />
as a mix of industrial output that is more heavily weighted toward non-energy-intensive industry sectors. As a result, the ratio of<br />
industrial energy consumption to total GDP tends to be higher in non-OECD economies than in OECD economies. On average,<br />
industrial energy intensity (the consumption of energy consumed in the industrial sector per dollar of economic output) in non-<br />
OECD countries is double that in OECD countries.<br />
It is also instructive to compare the mix of industrial sector fuels used in the OECD and non-OECD nations in the IEO<strong>2011</strong> Reference<br />
case. Of the five projected industrial fuel categories (renewable, electricity, natural gas, coal, and liquids), liquids is the dominant<br />
fuel throughout the projection period for OECD nations due to continued significant growth in the chemical sector in both the<br />
United States and the European Union, while coal is dominant in non-OECD countries due in part to China’s continuing heavy<br />
reliance on this accessible and relatively inexpensive resource for its coal-reliant industries such as steel and cement. Coal for<br />
OECD nations drops from 13 percent of the total industrial fuel mix in 2008 to 11 percent in 2035, due in part to a decline in the<br />
steel industry. Renewable fuel (biomass) makes up a small but growing percentage of the industrial sector energy mix in OECD<br />
nations (from 7 percent in 2008 to 10 percent in 2035), but in the non-OECD nations the renewable energy percentage of all fuels<br />
consumed drops slightly, because renewable fuel consumption grows more slowly than consumption of fossil fuels. In both the<br />
OECD and non-OECD regions, natural gas and electricity account for increasing shares of total industrial fuel use.<br />
Transportation sector<br />
<strong>Energy</strong> use in the transportation sector includes the energy consumed in moving people and goods by road, rail, air, water,<br />
and pipeline. The transportation sector accounted for 27 percent of total world delivered energy consumption in 2008, and<br />
transportation energy use increases by 1.4 percent per year from 2008 to 2035. The growth in transportation energy demand<br />
growth in the IEO<strong>2011</strong> Reference case is largely a result of increases projected for non-OECD nations, where fast-paced gains<br />
in GDP raise standards of living and, correspondingly, the demand for personal travel and freight transport to meet consumer<br />
demand for goods. Non-OECD transportation energy use increases by 2.6 percent per year, compared with 0.3 percent per year<br />
Figure 21. World delivered commercial energy<br />
consumption, 2008-2035 (quadrillion Btu)<br />
30<br />
20<br />
10<br />
0<br />
OECD<br />
Non-OECD<br />
2008 2015 2020 2025 2030 2035<br />
Figure 22. World delivered industrial energy<br />
consumption, 2008-2035 (quadrillion Btu)<br />
250<br />
200<br />
150<br />
100<br />
50<br />
0<br />
OECD<br />
Non-OECD<br />
2008 2015 2020 2025 2030 2035<br />
15


