

International Energy Outlook 2011 - EIA
International Energy Outlook 2011 - EIA
International Energy Outlook 2011 - EIA

Create successful ePaper yourself
Turn your PDF publications into a flip-book with our unique Google optimized e-Paper software.
Chapter 2<br />
Liquid fuels<br />
Overview<br />
Consumption of petroleum and other liquid fuels 15 increases from 85.7 million barrels per day in 2008 to 112.2 million barrels per<br />
day in 2035 in the IEO<strong>2011</strong> Reference case. Although world liquids consumption actually declined in 2009 (to 83.9 million barrels<br />
per day), it recovered in 2010 to an estimated 86.0 million barrels per day and is expected to continue increasing in <strong>2011</strong> and beyond<br />
as economic growth strengthens, especially among the developing non-OECD nations. In the long term, world liquids consumption<br />
increases despite world oil prices that rise to $125 per barrel (real 2009 dollars) by 2035. More than 75 percent of the increase in<br />
total liquids consumption is projected for the nations of non-OECD Asia and the Middle East, where strong economic growth and, in<br />
the case of the Middle East, access to ample and relatively inexpensive domestic resources drive the increase in demand (Figure 27).<br />
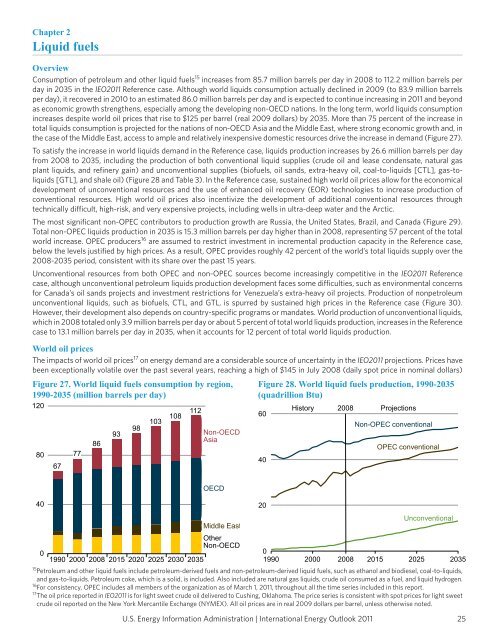
To satisfy the increase in world liquids demand in the Reference case, liquids production increases by 26.6 million barrels per day<br />
from 2008 to 2035, including the production of both conventional liquid supplies (crude oil and lease condensate, natural gas<br />
plant liquids, and refinery gain) and unconventional supplies (biofuels, oil sands, extra-heavy oil, coal-to-liquids [CTL], gas-toliquids<br />
[GTL], and shale oil) (Figure 28 and Table 3). In the Reference case, sustained high world oil prices allow for the economical<br />
development of unconventional resources and the use of enhanced oil recovery (EOR) technologies to increase production of<br />
conventional resources. High world oil prices also incentivize the development of additional conventional resources through<br />
technically difficult, high-risk, and very expensive projects, including wells in ultra-deep water and the Arctic.<br />
The most significant non-OPEC contributors to production growth are Russia, the United States, Brazil, and Canada (Figure 29).<br />
Total non-OPEC liquids production in 2035 is 15.3 million barrels per day higher than in 2008, representing 57 percent of the total<br />
world increase. OPEC producers 16 are assumed to restrict investment in incremental production capacity in the Reference case,<br />
below the levels justified by high prices. As a result, OPEC provides roughly 42 percent of the world’s total liquids supply over the<br />
2008-2035 period, consistent with its share over the past 15 years.<br />
Unconventional resources from both OPEC and non-OPEC sources become increasingly competitive in the IEO<strong>2011</strong> Reference<br />
case, although unconventional petroleum liquids production development faces some difficulties, such as environmental concerns<br />
for Canada’s oil sands projects and investment restrictions for Venezuela’s extra-heavy oil projects. Production of nonpetroleum<br />
unconventional liquids, such as biofuels, CTL, and GTL, is spurred by sustained high prices in the Reference case (Figure 30).<br />
However, their development also depends on country-specific programs or mandates. World production of unconventional liquids,<br />
which in 2008 totaled only 3.9 million barrels per day or about 5 percent of total world liquids production, increases in the Reference<br />
case to 13.1 million barrels per day in 2035, when it accounts for 12 percent of total world liquids production.<br />
World oil prices<br />
The impacts of world oil prices 17 on energy demand are a considerable source of uncertainty in the IEO<strong>2011</strong> projections. Prices have<br />
been exceptionally volatile over the past several years, reaching a high of $145 in July 2008 (daily spot price in nominal dollars)<br />
Figure 27. World liquid fuels consumption by region,<br />
1990-2035 (million barrels per day)<br />
120<br />
80<br />
40<br />
0<br />
67<br />
77<br />
86<br />
93<br />
98<br />
103 108<br />
112<br />
1990 2000 2008 2015 2020 2025 2030 2035<br />
Non-OECD<br />
Asia<br />
OECD<br />
Middle East<br />
Other<br />
Non-OECD<br />
Figure 28. World liquid fuels production, 1990-2035<br />
(quadrillion Btu)<br />
0<br />
1990 2000 2008 2015 2025 2035<br />
15 Petroleum and other liquid fuels include petroleum-derived fuels and non-petroleum-derived liquid fuels, such as ethanol and biodiesel, coal-to-liquids,<br />
and gas-to-liquids. Petroleum coke, which is a solid, is included. Also included are natural gas liquids, crude oil consumed as a fuel, and liquid hydrogen.<br />
16 For consistency, OPEC includes all members of the organization as of March 1, <strong>2011</strong>, throughout all the time series included in this report.<br />
17 The oil price reported in IEO<strong>2011</strong> is for light sweet crude oil delivered to Cushing, Oklahoma. The price series is consistent with spot prices for light sweet<br />
crude oil reported on the New York Mercantile Exchange (NYMEX). All oil prices are in real 2009 dollars per barrel, unless otherwise noted.<br />
U.S. <strong>Energy</strong> Information Administration | <strong>International</strong> <strong>Energy</strong> <strong>Outlook</strong> <strong>2011</strong><br />
60<br />
40<br />
20<br />
History 2008 Projections<br />
Non-OPEC conventional<br />
OPEC conventional<br />
Unconventional<br />
25


